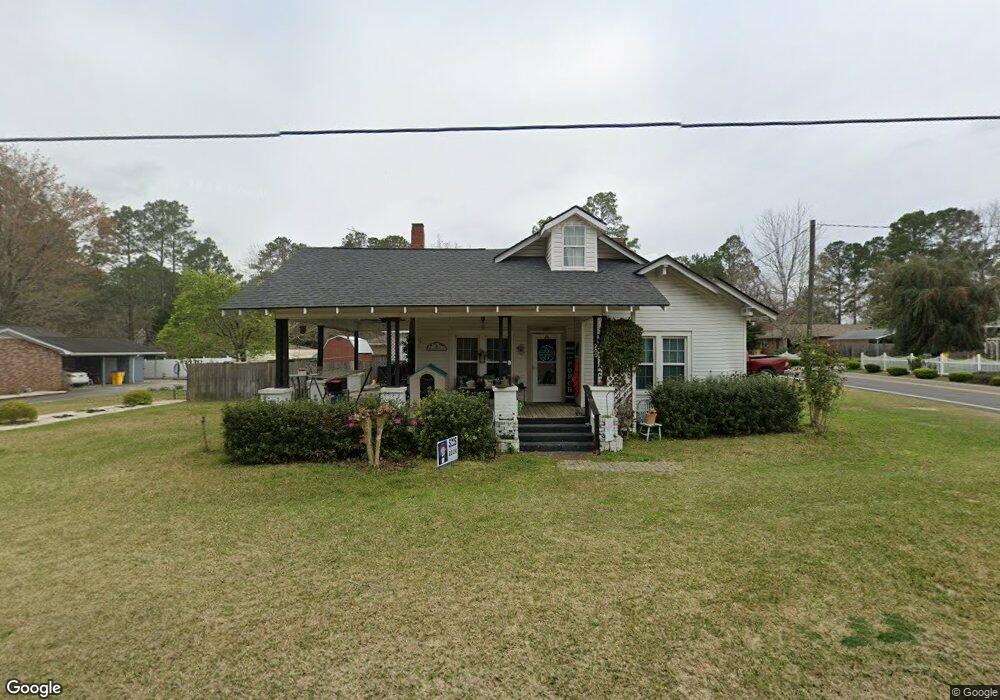
200 S Cromley Rd Brooklet, GA 30415
Estimated Value: $247,866 - $335,000
3
Beds
2
Baths
2,004
Sq Ft
$140/Sq Ft
Est. Value
About This Home
This home is located at 200 S Cromley Rd, Brooklet, GA 30415 and is currently estimated at $280,217, approximately $139 per square foot. 200 S Cromley Rd is a home located in Bulloch County with nearby schools including Brooklet Elementary School, Southeast Bulloch High School, and Southeast Bulloch Middle School.
Ownership History
Date
Name
Owned For
Owner Type
Purchase Details
Closed on
Dec 30, 2014
Sold by
Dinello Stacy R
Bought by
Dinello Edward C
Current Estimated Value
Home Financials for this Owner
Home Financials are based on the most recent Mortgage that was taken out on this home.
Original Mortgage
$144,000
Outstanding Balance
$110,227
Interest Rate
3.98%
Mortgage Type
New Conventional
Estimated Equity
$169,990
Purchase Details
Closed on
Nov 27, 2006
Sold by
Not Provided
Bought by
Dinello Dinello Edward C Edward C and Dinello Stacy R
Home Financials for this Owner
Home Financials are based on the most recent Mortgage that was taken out on this home.
Original Mortgage
$159,600
Interest Rate
6.36%
Mortgage Type
New Conventional
Purchase Details
Closed on
Oct 1, 2002
Bought by
Murray Janis N
Purchase Details
Closed on
Aug 1, 2000
Bought by
Howard Chad J
Create a Home Valuation Report for This Property
The Home Valuation Report is an in-depth analysis detailing your home's value as well as a comparison with similar homes in the area
Home Values in the Area
Average Home Value in this Area
Purchase History
| Date | Buyer | Sale Price | Title Company |
|---|---|---|---|
| Dinello Edward C | -- | -- | |
| Dinello Dinello Edward C Edward C | $168,000 | -- | |
| Murray Janis N | -- | -- | |
| Howard Chad J | -- | -- |
Source: Public Records
Mortgage History
| Date | Status | Borrower | Loan Amount |
|---|---|---|---|
| Open | Dinello Edward C | $144,000 | |
| Previous Owner | Dinello Dinello Edward C Edward C | $159,600 |
Source: Public Records
Tax History Compared to Growth
Tax History
| Year | Tax Paid | Tax Assessment Tax Assessment Total Assessment is a certain percentage of the fair market value that is determined by local assessors to be the total taxable value of land and additions on the property. | Land | Improvement |
|---|---|---|---|---|
| 2024 | $1,997 | $70,500 | $6,120 | $64,380 |
| 2023 | $1,938 | $62,152 | $6,120 | $56,032 |
| 2022 | $1,172 | $54,282 | $6,120 | $48,162 |
| 2021 | $1,041 | $47,024 | $6,120 | $40,904 |
| 2020 | $1,017 | $44,744 | $6,120 | $38,624 |
| 2019 | $1,027 | $44,968 | $6,120 | $38,848 |
| 2018 | $994 | $43,228 | $6,120 | $37,108 |
| 2017 | $966 | $41,437 | $6,120 | $35,317 |
| 2016 | $954 | $39,884 | $6,120 | $33,764 |
| 2015 | $936 | $38,938 | $6,120 | $32,818 |
| 2014 | $864 | $38,938 | $6,120 | $32,818 |
Source: Public Records
Map
Nearby Homes
- 207 Dixie St
- 210 Parker Ave N
- 10143 U S 80
- 209 Elm St
- 616 Pinewood Dr
- 713 W Lane St
- 305 Treasure Blvd
- 893 W Lane St
- 1705 Scarlett Place
- 129 Orchard Way Unit LOT 15
- 127 Orchard Way Unit LOT 14
- 129 Orchard Way
- 131 Orchard Way
- 127 Orchard Way
- 131 Orchard Way Unit LOT 16
- 19477 Us Highway 80 E
- 0 Old Leefield Rd Unit 10626397
- 0 E Highway 80 Hwy Unit 10490324
- 1805 Nottingham Rd
- 1603 Lennox Rd
- 204 S Cromley Rd
- 305 Lewis St
- 104 S Cromley Rd
- 105 Waters St
- 205 S Cromley Rd
- 102 S Cromley Rd
- 207 S Cromley Rd
- 103 Waters St
- 213 W Lee St
- 206 Waters St
- 206 Waters St Unit Lot 2-3
- 400 Lewis St
- 209 S Cromley Rd
- 100 S Cromley Rd
- 211 W Lee St
- 104 Waters St
- 305 W Lee St
- 0 W Lee St Unit 8788576
- W W Lee St
- 0 W Lee St Unit 8479452