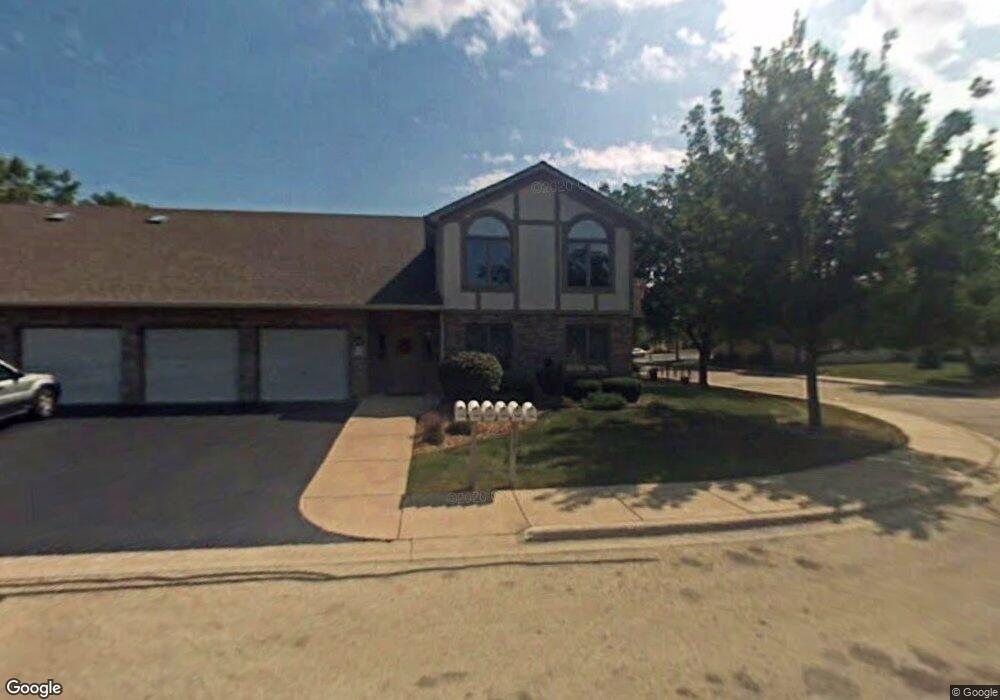
200 Saenz Ln Unit 11F Joliet, IL 60436
Southwest Joliet NeighborhoodEstimated Value: $199,719 - $218,000
--
Bed
2
Baths
1,365
Sq Ft
$154/Sq Ft
Est. Value
About This Home
This home is located at 200 Saenz Ln Unit 11F, Joliet, IL 60436 and is currently estimated at $210,180, approximately $153 per square foot. 200 Saenz Ln Unit 11F is a home located in Will County with nearby schools including Heritage Trail Elementary School, Troy Middle School, and Orenic Intermediate School.
Ownership History
Date
Name
Owned For
Owner Type
Purchase Details
Closed on
Mar 18, 2015
Sold by
Dowhen William R
Bought by
Dowhen William R and The William R Dowhen Trust
Current Estimated Value
Purchase Details
Closed on
Jul 7, 1998
Sold by
King Betty E and King Family Trust
Bought by
Dowhen Richard H and Dowhen Lucille D
Home Financials for this Owner
Home Financials are based on the most recent Mortgage that was taken out on this home.
Original Mortgage
$40,000
Interest Rate
7.17%
Purchase Details
Closed on
Jul 31, 1995
Sold by
First National Bank Of Manhattan
Bought by
Strong Norbert A and Strong Shirley R
Home Financials for this Owner
Home Financials are based on the most recent Mortgage that was taken out on this home.
Original Mortgage
$60,000
Interest Rate
7.5%
Create a Home Valuation Report for This Property
The Home Valuation Report is an in-depth analysis detailing your home's value as well as a comparison with similar homes in the area
Home Values in the Area
Average Home Value in this Area
Purchase History
| Date | Buyer | Sale Price | Title Company |
|---|---|---|---|
| Dowhen William R | -- | Old Republic Natl Title Ins | |
| Dowhen Richard H | $90,000 | Chicago Title Insurance Co | |
| Strong Norbert A | $86,000 | Chicago Title Insurance Co |
Source: Public Records
Mortgage History
| Date | Status | Borrower | Loan Amount |
|---|---|---|---|
| Previous Owner | Dowhen Richard H | $40,000 | |
| Previous Owner | Strong Norbert A | $60,000 |
Source: Public Records
Tax History Compared to Growth
Tax History
| Year | Tax Paid | Tax Assessment Tax Assessment Total Assessment is a certain percentage of the fair market value that is determined by local assessors to be the total taxable value of land and additions on the property. | Land | Improvement |
|---|---|---|---|---|
| 2024 | $1,828 | $61,729 | $8,855 | $52,874 |
| 2023 | $1,828 | $55,462 | $7,956 | $47,506 |
| 2022 | $2,396 | $47,309 | $7,528 | $39,781 |
| 2021 | $2,399 | $44,505 | $7,082 | $37,423 |
| 2020 | $3,053 | $38,818 | $7,082 | $31,736 |
| 2019 | $2,949 | $37,235 | $6,793 | $30,442 |
| 2018 | $2,674 | $33,493 | $6,793 | $26,700 |
| 2017 | $2,602 | $32,232 | $6,793 | $25,439 |
| 2016 | $2,698 | $32,232 | $6,793 | $25,439 |
| 2015 | $2,145 | $31,293 | $6,793 | $24,500 |
| 2014 | $2,145 | $31,300 | $6,793 | $24,507 |
| 2013 | $2,145 | $31,968 | $6,793 | $25,175 |
Source: Public Records
Map
Nearby Homes
- 2632 Crescenzo Dr
- 2670 Jodee Dr Unit B
- 2689 Jodee Dr Unit B
- 2628 Eagle Dr Unit 2628
- 2365 W Jefferson St
- 2300 Webster Ave
- 574 Spring Leaf Dr
- 305 Saint Jude Ave
- 260 Crabapple Dr
- 116 Saint Jude Ave
- 218 Madison St Unit 1C
- 222 Madison St Unit 404
- 222 Madison St Unit 208
- 222 Madison St Unit 508
- 220 Madison St Unit 1C
- 509 Kungs Way
- 601 Fairlane Dr
- 2319 Taylor St
- 914 Greenleaf Dr
- 620 Tana Ln
- 196 Saenz Ln Unit D
- 198 Saenz Ln Unit 11E
- 192 Saenz Ln Unit 11B
- 190 Saenz Ln
- 194 Saenz Ln
- 192 Saenz Ln Unit B
- 2649 Crescenzo Dr Unit 8A
- 2653 Crescenzo Dr
- 2655 Crescenzo Dr Unit D
- 2651 Crescenzo Dr Unit 8B
- 2651 Crescenzo Dr Unit 3
- 199 Saenz Ln Unit 12B
- 195 Saenz Ln Unit 12D
- 197 Saenz Ln Unit 12A
- 189 Saenz Ln Unit 12E
- 191 Saenz Ln
- 199 Saenz Ln Unit 3
- 189 Saenz Ln Unit 6
- 197 Saenz Ln Unit A
- 193 Saenz Ln Unit 12C