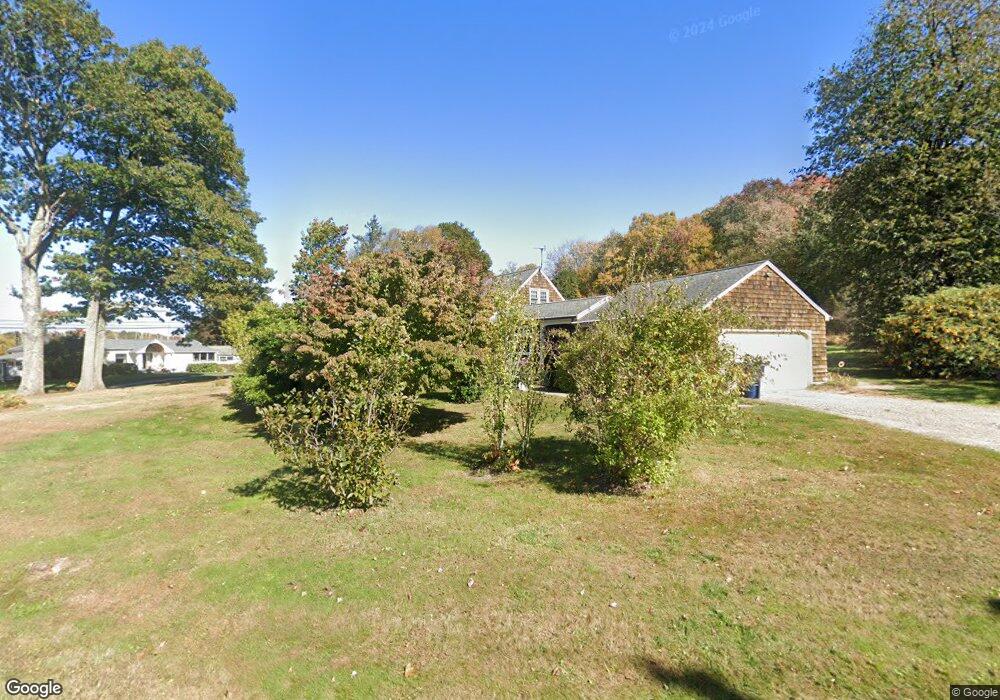
200 Schroback Rd Plymouth, CT 06782
Estimated Value: $371,957 - $452,000
3
Beds
1
Bath
1,703
Sq Ft
$236/Sq Ft
Est. Value
About This Home
This home is located at 200 Schroback Rd, Plymouth, CT 06782 and is currently estimated at $402,739, approximately $236 per square foot. 200 Schroback Rd is a home located in Litchfield County with nearby schools including Plymouth Center School, Eli Terry Jr. Middle School, and Terryville High School.
Ownership History
Date
Name
Owned For
Owner Type
Purchase Details
Closed on
Sep 8, 2019
Sold by
Cote Stephen
Bought by
Cote Lori
Current Estimated Value
Purchase Details
Closed on
Jul 29, 2019
Sold by
Cote Lori
Bought by
Cote Stephen
Purchase Details
Closed on
Jul 8, 2019
Sold by
Cote Stephen and Cote Lori
Bought by
Cote Stephen and Cote Lori
Purchase Details
Closed on
Aug 27, 2010
Sold by
Henderson Robert R and Henderson Janee
Bought by
Cote Stephen M and Barry Lori M
Home Financials for this Owner
Home Financials are based on the most recent Mortgage that was taken out on this home.
Original Mortgage
$197,600
Interest Rate
4.57%
Purchase Details
Closed on
Jun 23, 1998
Sold by
Henderson Helen J
Bought by
Henderson Robert R and Henderson Jane E
Create a Home Valuation Report for This Property
The Home Valuation Report is an in-depth analysis detailing your home's value as well as a comparison with similar homes in the area
Home Values in the Area
Average Home Value in this Area
Purchase History
| Date | Buyer | Sale Price | Title Company |
|---|---|---|---|
| Cote Lori | -- | -- | |
| Cote Lori | -- | -- | |
| Cote Stephen | -- | -- | |
| Cote Stephen | -- | -- | |
| Cote Stephen | -- | -- | |
| Cote Stephen | -- | -- | |
| Cote Stephen M | $247,000 | -- | |
| Cote Stephen M | $247,000 | -- | |
| Henderson Robert R | $200,000 | -- | |
| Henderson Robert R | $200,000 | -- |
Source: Public Records
Mortgage History
| Date | Status | Borrower | Loan Amount |
|---|---|---|---|
| Previous Owner | Henderson Robert R | $21,500 | |
| Previous Owner | Henderson Robert R | $190,000 | |
| Previous Owner | Henderson Robert R | $197,600 |
Source: Public Records
Tax History Compared to Growth
Tax History
| Year | Tax Paid | Tax Assessment Tax Assessment Total Assessment is a certain percentage of the fair market value that is determined by local assessors to be the total taxable value of land and additions on the property. | Land | Improvement |
|---|---|---|---|---|
| 2025 | $6,504 | $164,360 | $64,820 | $99,540 |
| 2024 | $6,351 | $164,360 | $64,820 | $99,540 |
| 2023 | $6,196 | $164,360 | $64,820 | $99,540 |
| 2022 | $5,970 | $164,360 | $64,820 | $99,540 |
| 2021 | $6,267 | $154,238 | $73,290 | $80,948 |
| 2020 | $6,267 | $154,238 | $73,290 | $80,948 |
| 2019 | $6,267 | $154,238 | $73,290 | $80,948 |
| 2016 | $5,829 | $161,819 | $73,290 | $88,529 |
| 2015 | $5,733 | $161,819 | $73,290 | $88,529 |
| 2014 | $5,639 | $161,819 | $73,290 | $88,529 |
Source: Public Records
Map
Nearby Homes