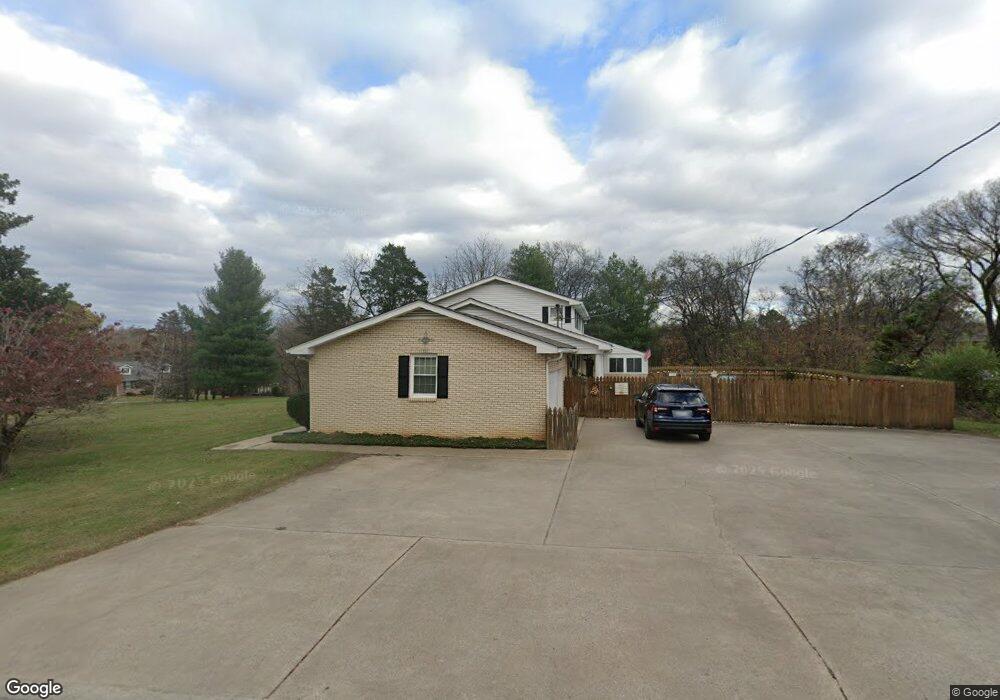
200 Spring Rd Old Hickory, TN 37138
Estimated Value: $623,000 - $798,000
4
Beds
4
Baths
3,686
Sq Ft
$192/Sq Ft
Est. Value
About This Home
This home is located at 200 Spring Rd, Old Hickory, TN 37138 and is currently estimated at $706,357, approximately $191 per square foot. 200 Spring Rd is a home located in Wilson County with nearby schools including Lakeview Elementary School, Mt. Juliet Middle School, and Green Hill High School.
Ownership History
Date
Name
Owned For
Owner Type
Purchase Details
Closed on
Sep 9, 2016
Sold by
Ponzetti Justin and Ponzetti Kristina J
Bought by
Green Derrick H and Green Jessica L
Current Estimated Value
Purchase Details
Closed on
Jul 20, 2015
Sold by
Stacy Barry R
Bought by
Ponzetti Justin and Ponzetti Kristina J
Home Financials for this Owner
Home Financials are based on the most recent Mortgage that was taken out on this home.
Original Mortgage
$315,000
Interest Rate
4.04%
Mortgage Type
New Conventional
Purchase Details
Closed on
Jun 18, 2002
Sold by
Roy Fisher W and Roy Yvonne A
Bought by
Stacy Barry R
Home Financials for this Owner
Home Financials are based on the most recent Mortgage that was taken out on this home.
Original Mortgage
$160,000
Interest Rate
5.38%
Purchase Details
Closed on
Mar 29, 1985
Bought by
Fisher Fisher W and Fisher Yvonne
Create a Home Valuation Report for This Property
The Home Valuation Report is an in-depth analysis detailing your home's value as well as a comparison with similar homes in the area
Home Values in the Area
Average Home Value in this Area
Purchase History
We collect this data history from publicly available records. To have your information removed, we recommend requesting removal directly through your county’s website.
| Date | Buyer | Sale Price | Title Company |
|---|---|---|---|
| Green Derrick H | $303,424 | Greater Nashville Title | |
| Ponzetti Justin | $315,000 | -- | |
| Stacy Barry R | $200,000 | -- | |
| Fisher Fisher W | -- | -- |
Source: Public Records
Mortgage History
We collect this data history from publicly available records. To have your information removed, we recommend requesting removal directly through your county’s website.
| Date | Status | Borrower | Loan Amount |
|---|---|---|---|
| Previous Owner | Ponzetti Justin | $315,000 | |
| Previous Owner | Fisher Fisher W | $160,000 |
Source: Public Records
Tax History
| Year | Tax Paid | Tax Assessment Tax Assessment Total Assessment is a certain percentage of the fair market value that is determined by local assessors to be the total taxable value of land and additions on the property. | Land | Improvement |
|---|---|---|---|---|
| 2025 | $2,106 | $110,350 | $17,500 | $92,850 |
| 2024 | $2,106 | $110,350 | $17,500 | $92,850 |
| 2022 | $2,106 | $110,350 | $17,500 | $92,850 |
| 2021 | $2,012 | $105,375 | $17,500 | $87,875 |
| 2020 | $1,434 | $105,375 | $17,500 | $87,875 |
| 2019 | $1,434 | $56,925 | $16,025 | $40,900 |
| 2018 | $1,434 | $56,925 | $16,025 | $40,900 |
| 2017 | $1,434 | $56,925 | $16,025 | $40,900 |
| 2016 | $1,434 | $56,925 | $16,025 | $40,900 |
| 2015 | $1,463 | $56,925 | $16,025 | $40,900 |
| 2014 | $1,452 | $56,475 | $0 | $0 |
Source: Public Records
Map
Nearby Homes
- 304 Hickory Dr
- 300 Hickory Dr Unit 27
- 5133 Brittany Dr
- 5006 Langford Pass
- 808 Overhills Dr
- 500 Lakeshore Dr
- 425 Lakeshore Dr
- 5250 Rustic Way
- 106 E Shady Trail
- 5259 Rustic Way
- 5032 Twin Lakes Dr
- 4811 Wayside Dr
- 4803 Wayside Dr
- 936 Bay Dr
- 4825 Morgan Dr
- 4812 Wayside Dr
- 4816 Wayside Dr
- 1795 Needmore Rd
- 4858 Quail Run
- 107 Avalon Bay Dr
- 5404 Valley Dr
- 122 Lakeshore Dr
- 124 Lakeshore Dr
- 203 Spring Rd
- 5405 Valley Dr
- 205 Spring Rd
- 120 Lakeshore Dr
- 207 Spring Rd
- 131 Lakeshore Dr
- 5402 Valley Dr
- 5403 Valley Dr
- 210 Spring Rd
- 126 Lakeshore Dr
- 202 Hickory Dr
- 5305 E Bend Dr
- 118 Lakeshore Dr
- 204 Hickory Dr
- 5303 E Bend Dr
- 135 Lakeshore Dr
- 211 Spring Rd
Your Personal Tour Guide
Ask me questions while you tour the home.