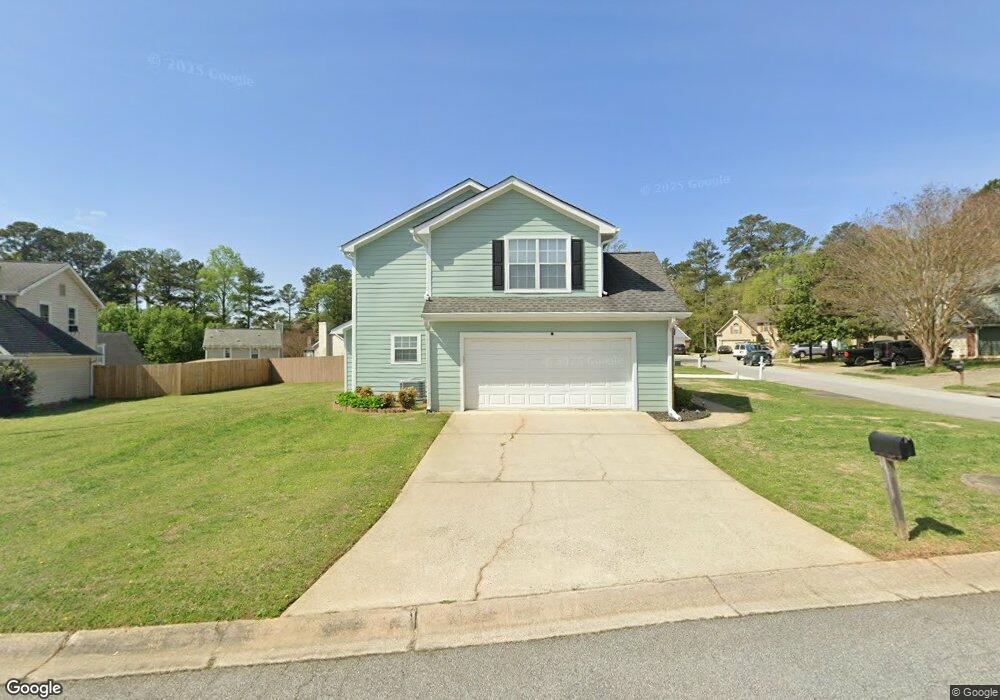
200 Summer Mist Ct SW Marietta, GA 30060
Southwestern Marietta NeighborhoodEstimated Value: $295,000 - $324,466
3
Beds
3
Baths
1,314
Sq Ft
$238/Sq Ft
Est. Value
About This Home
This home is located at 200 Summer Mist Ct SW, Marietta, GA 30060 and is currently estimated at $312,617, approximately $237 per square foot. 200 Summer Mist Ct SW is a home located in Cobb County with nearby schools including LaBelle Elementary School, Smitha Middle School, and Osborne High School.
Ownership History
Date
Name
Owned For
Owner Type
Purchase Details
Closed on
Nov 3, 2008
Sold by
2007-Mln1 Wells Far Sasco
Bought by
Mcdonald Gracie
Current Estimated Value
Home Financials for this Owner
Home Financials are based on the most recent Mortgage that was taken out on this home.
Original Mortgage
$107,250
Outstanding Balance
$70,214
Interest Rate
6.11%
Mortgage Type
VA
Estimated Equity
$242,403
Purchase Details
Closed on
Aug 7, 2007
Sold by
Olanrewaju Sanni M
Bought by
Wells Fargo Bk Na
Purchase Details
Closed on
May 6, 2002
Sold by
Perry Rosa M
Bought by
Olanrewaju Sanni
Home Financials for this Owner
Home Financials are based on the most recent Mortgage that was taken out on this home.
Original Mortgage
$132,050
Interest Rate
7.18%
Mortgage Type
New Conventional
Purchase Details
Closed on
Mar 1, 1994
Sold by
Knight Davidson Companies Inc
Bought by
Perry Rosa M
Home Financials for this Owner
Home Financials are based on the most recent Mortgage that was taken out on this home.
Original Mortgage
$82,000
Interest Rate
6.96%
Create a Home Valuation Report for This Property
The Home Valuation Report is an in-depth analysis detailing your home's value as well as a comparison with similar homes in the area
Home Values in the Area
Average Home Value in this Area
Purchase History
| Date | Buyer | Sale Price | Title Company |
|---|---|---|---|
| Mcdonald Gracie | $105,000 | -- | |
| Wells Fargo Bk Na | $133,719 | -- | |
| Olanrewaju Sanni | $139,800 | -- | |
| Perry Rosa M | $87,200 | -- |
Source: Public Records
Mortgage History
| Date | Status | Borrower | Loan Amount |
|---|---|---|---|
| Open | Mcdonald Gracie | $107,250 | |
| Previous Owner | Olanrewaju Sanni | $132,050 | |
| Previous Owner | Perry Rosa M | $82,000 |
Source: Public Records
Tax History Compared to Growth
Tax History
| Year | Tax Paid | Tax Assessment Tax Assessment Total Assessment is a certain percentage of the fair market value that is determined by local assessors to be the total taxable value of land and additions on the property. | Land | Improvement |
|---|---|---|---|---|
| 2025 | $2,587 | $110,840 | $28,000 | $82,840 |
| 2024 | $2,589 | $110,840 | $28,000 | $82,840 |
| 2023 | $1,759 | $97,580 | $28,000 | $69,580 |
| 2022 | $2,319 | $97,580 | $28,000 | $69,580 |
| 2021 | $1,762 | $72,136 | $28,000 | $44,136 |
| 2020 | $1,750 | $71,588 | $12,000 | $59,588 |
| 2019 | $1,589 | $64,244 | $9,600 | $54,644 |
| 2018 | $1,334 | $52,980 | $9,600 | $43,380 |
| 2017 | $1,267 | $52,980 | $9,600 | $43,380 |
| 2016 | $1,122 | $47,920 | $9,600 | $38,320 |
| 2015 | $820 | $36,672 | $9,600 | $27,072 |
| 2014 | $827 | $36,672 | $0 | $0 |
Source: Public Records
Map
Nearby Homes
- 152 Summer Lake Dr SW
- 2036 Favor Rd SW
- 1809 Austell Rd SW
- 2078 Olive Springs Rd SE
- 166 Zelma St SW
- 2245 Panstone Dr SW
- 1763 Sandtown Rd SW
- 2354 Holly Hill Ct SW
- 1958 Judy Cir SE
- 1840 Judy Cir SE
- 2177 Wakita Dr SE
- 29 Burke St SE
- 2379 Olive Springs Rd SE
- 1615 Arden Dr SW
- 2675 Sandtown Rd SW
- 55 Cochran Rd SE
- 1631 Knox Dr SE
- 309 Summer Cove SW
- 0 Summer Mist Ct Unit 7272567
- 0 Summer Mist Ct
- 202 Summer Mist Ct SW
- 0 Summer Cove NW Unit 7337589
- 0 Summer Cove NW Unit 3091193
- 0 Summer Cove NW Unit 3106803
- 0 Summer Cove NW Unit 3219076
- 311 Summer Cove SW
- 201 Summer Mist Ct SW
- 308 Summer Cove NW
- 204 Summer Mist Ct SW
- 308 Summer Cove SW
- 203 Summer Mist Ct SW
- 310 Summer Cove SW
- 304 Summer Cove SW
- 206 Summer Mist Ct SW
- 205 Summer Mist Ct SW
- 181 Summer Lake Dr SW
- 313 Summer Cove SW Unit 70