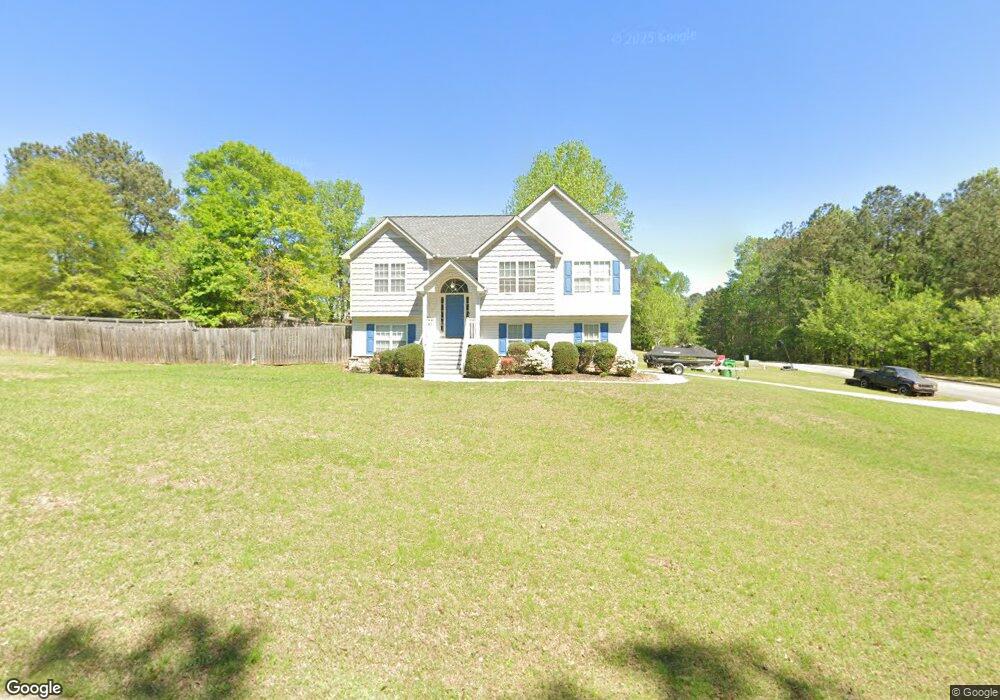
200 Thornberry Cir Carrollton, GA 30116
Abilene NeighborhoodEstimated Value: $255,824 - $275,000
3
Beds
3
Baths
1,268
Sq Ft
$208/Sq Ft
Est. Value
About This Home
This home is located at 200 Thornberry Cir, Carrollton, GA 30116 and is currently estimated at $263,706, approximately $207 per square foot. 200 Thornberry Cir is a home located in Carroll County with nearby schools including Sand Hill Elementary School, Bay Springs Middle School, and Villa Rica High School.
Ownership History
Date
Name
Owned For
Owner Type
Purchase Details
Closed on
Aug 30, 2005
Sold by
Federal National Mortgage Association
Bought by
Shedd Matthew S
Current Estimated Value
Home Financials for this Owner
Home Financials are based on the most recent Mortgage that was taken out on this home.
Original Mortgage
$125,149
Outstanding Balance
$66,618
Interest Rate
5.77%
Mortgage Type
FHA
Estimated Equity
$197,088
Purchase Details
Closed on
Feb 1, 2005
Sold by
Busbin Jeremy R
Bought by
Union Planters Bank
Purchase Details
Closed on
Mar 26, 2004
Sold by
Stagner David
Bought by
Busbin Jeremy R
Purchase Details
Closed on
Aug 7, 2003
Sold by
Little Ronda Etals
Bought by
Stagner David
Purchase Details
Closed on
Jul 15, 2003
Sold by
Little Ronda
Bought by
Little Ronda Etals
Purchase Details
Closed on
Jun 2, 2003
Bought by
Little Ronda
Create a Home Valuation Report for This Property
The Home Valuation Report is an in-depth analysis detailing your home's value as well as a comparison with similar homes in the area
Home Values in the Area
Average Home Value in this Area
Purchase History
| Date | Buyer | Sale Price | Title Company |
|---|---|---|---|
| Shedd Matthew S | $127,113 | -- | |
| Union Planters Bank | -- | -- | |
| Federal National Mtg Associati | $111,833 | -- | |
| Busbin Jeremy R | $131,000 | -- | |
| Stagner David | $27,000 | -- | |
| Little Ronda Etals | $1,350,000 | -- | |
| Little Ronda | -- | -- |
Source: Public Records
Mortgage History
| Date | Status | Borrower | Loan Amount |
|---|---|---|---|
| Open | Shedd Matthew S | $125,149 |
Source: Public Records
Tax History Compared to Growth
Tax History
| Year | Tax Paid | Tax Assessment Tax Assessment Total Assessment is a certain percentage of the fair market value that is determined by local assessors to be the total taxable value of land and additions on the property. | Land | Improvement |
|---|---|---|---|---|
| 2023 | $1,840 | $93,774 | $8,000 | $85,774 |
| 2022 | $1,544 | $76,861 | $8,000 | $68,861 |
| 2021 | $1,405 | $67,011 | $8,000 | $59,011 |
| 2020 | $1,295 | $60,860 | $8,000 | $52,860 |
| 2019 | $1,234 | $57,045 | $8,000 | $49,045 |
| 2018 | $1,036 | $45,326 | $8,000 | $37,326 |
| 2017 | $1,039 | $45,326 | $8,000 | $37,326 |
| 2016 | $1,040 | $45,326 | $8,000 | $37,326 |
| 2015 | $991 | $39,416 | $8,000 | $31,417 |
| 2014 | $995 | $39,417 | $8,000 | $31,417 |
Source: Public Records
Map
Nearby Homes
- 136 Jennifer Ln
- 150 Old Sandhill Rd
- 160 Old Sandhill Rd
- 55 Sage Hill Dr
- 27 Mimosa Cir
- 0
- 202 Old Sandhill Rd
- 0 Roy Morgan Rd Unit 17.44 ACRES
- 160 & 168 Roy Morgan Rd
- 0 Roy Morgan Rd Unit 7671946
- 119 Muscadine Way
- 125 Muscadine Way
- 135 Mccoy Dr
- 382 Price Rd
- 15 Pine Chase
- 3487 Carrollton Villa Rica Hwy
- 22 Shell Rd
- 0 Dock Hyde Rd Unit 10627769
- 377 Dock Hyde Rd
- 472 Price Rd
- 206 Thornberry Cir
- 124 Hawthorn Dr
- 118 Hawthorn Dr
- 212 Thornberry Cir
- 556 Sand Hill Shady Grove Rd
- 556 Sandhill Shady Grove Rd
- 125 Hawthorn Dr
- 218 Thornberry Cir
- 112 Hawthorn Dr
- 100 Jennifer Ln
- 107 Hawthorn Dr
- 132 Hawthorn Dr
- 106 Hawthorn Dr
- 224 Thornberry Cir
- 119 Hawthorn Dr
- 112 Jennifer Ln
- 131 Hawthorn Dr
- 138 Hawthorn Dr
- 552 Sandhill Shady Grove Rd
- 38 Jennifer Ln