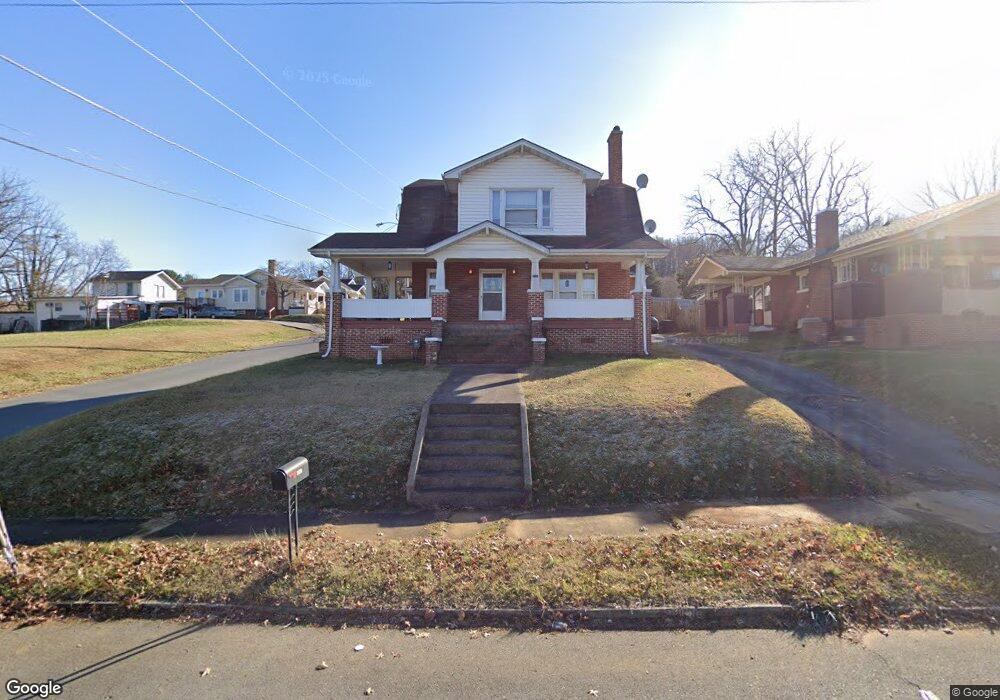
200 W K St Elizabethton, TN 37643
Estimated Value: $167,000 - $318,000
--
Bed
2
Baths
2,020
Sq Ft
$120/Sq Ft
Est. Value
About This Home
This home is located at 200 W K St, Elizabethton, TN 37643 and is currently estimated at $242,872, approximately $120 per square foot. 200 W K St is a home located in Carter County with nearby schools including Elizabethton High School and East Tn Christian Home & Academy.
Ownership History
Date
Name
Owned For
Owner Type
Purchase Details
Closed on
Dec 2, 2014
Sold by
Sheehan John P Estate
Bought by
Harkleroad Bruce W
Current Estimated Value
Home Financials for this Owner
Home Financials are based on the most recent Mortgage that was taken out on this home.
Original Mortgage
$75,000
Outstanding Balance
$57,808
Interest Rate
4.09%
Mortgage Type
New Conventional
Estimated Equity
$185,064
Purchase Details
Closed on
Apr 24, 1996
Sold by
Sheehan John P
Bought by
Melton David
Purchase Details
Closed on
May 29, 1968
Bought by
Sheehan John P and Sheehan Gloria G
Create a Home Valuation Report for This Property
The Home Valuation Report is an in-depth analysis detailing your home's value as well as a comparison with similar homes in the area
Home Values in the Area
Average Home Value in this Area
Purchase History
| Date | Buyer | Sale Price | Title Company |
|---|---|---|---|
| Harkleroad Bruce W | $60,000 | -- | |
| Melton David | $4,600 | -- | |
| Sheehan John P | -- | -- |
Source: Public Records
Mortgage History
| Date | Status | Borrower | Loan Amount |
|---|---|---|---|
| Open | Harkleroad Bruce W | $75,000 |
Source: Public Records
Tax History Compared to Growth
Tax History
| Year | Tax Paid | Tax Assessment Tax Assessment Total Assessment is a certain percentage of the fair market value that is determined by local assessors to be the total taxable value of land and additions on the property. | Land | Improvement |
|---|---|---|---|---|
| 2024 | $1,156 | $35,025 | $5,450 | $29,575 |
| 2023 | $1,156 | $35,025 | $0 | $0 |
| 2022 | $1,261 | $35,025 | $5,450 | $29,575 |
| 2021 | $711 | $35,025 | $5,450 | $29,575 |
| 2020 | $1,219 | $35,025 | $5,450 | $29,575 |
| 2019 | $1,219 | $28,225 | $2,850 | $25,375 |
| 2018 | $1,202 | $28,225 | $2,850 | $25,375 |
| 2017 | $1,202 | $28,225 | $2,850 | $25,375 |
| 2016 | $1,197 | $28,225 | $2,850 | $25,375 |
| 2015 | $1,200 | $28,225 | $2,850 | $25,375 |
| 2014 | $1,175 | $27,525 | $2,850 | $24,675 |
Source: Public Records
Map
Nearby Homes