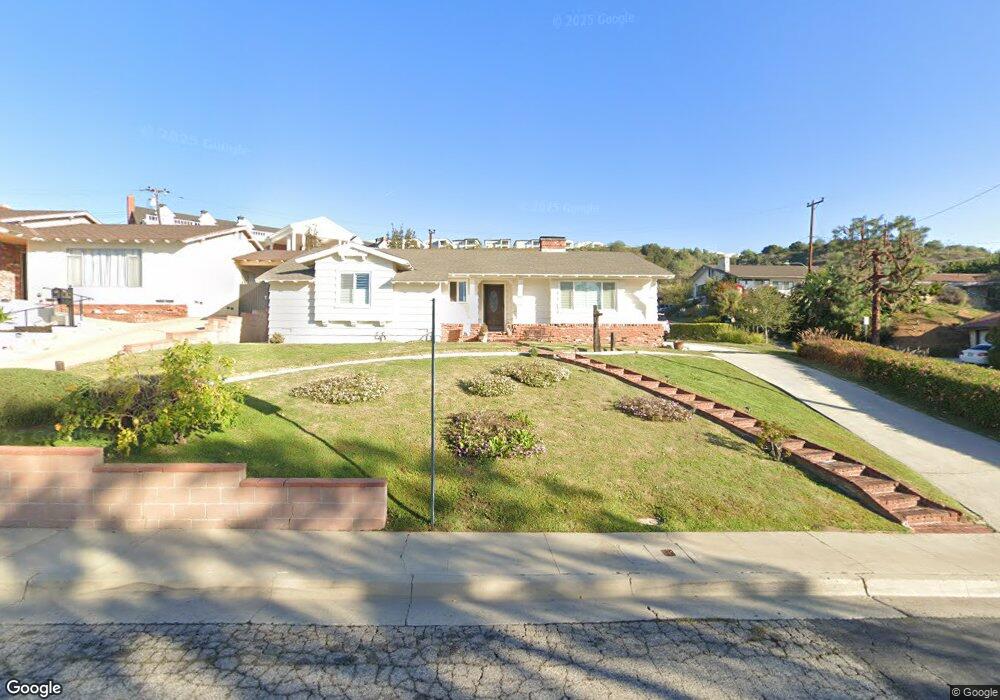
200 W Los Amigos Ave Montebello, CA 90640
Estimated Value: $923,000 - $1,051,000
3
Beds
2
Baths
1,776
Sq Ft
$543/Sq Ft
Est. Value
About This Home
This home is located at 200 W Los Amigos Ave, Montebello, CA 90640 and is currently estimated at $964,817, approximately $543 per square foot. 200 W Los Amigos Ave is a home located in Los Angeles County with nearby schools including La Merced Elementary School, La Merced Intermediate School, and Montebello High School.
Ownership History
Date
Name
Owned For
Owner Type
Purchase Details
Closed on
Mar 29, 2016
Sold by
Chavarria Ronald
Bought by
Chavarria Vickie
Current Estimated Value
Purchase Details
Closed on
May 10, 2005
Sold by
Chavarria Ronald
Bought by
Chavarria Ronald and Chavarria Vickie
Home Financials for this Owner
Home Financials are based on the most recent Mortgage that was taken out on this home.
Original Mortgage
$180,000
Interest Rate
6.02%
Mortgage Type
New Conventional
Purchase Details
Closed on
Jul 18, 2003
Sold by
Chavarria Vickie
Bought by
Chavarria Ronald
Home Financials for this Owner
Home Financials are based on the most recent Mortgage that was taken out on this home.
Original Mortgage
$95,000
Interest Rate
5.13%
Mortgage Type
Purchase Money Mortgage
Purchase Details
Closed on
Feb 3, 2000
Sold by
Chavarria Amalia T
Bought by
Chavarria Ronald
Purchase Details
Closed on
Oct 21, 1996
Sold by
Chavarria Amalia T
Bought by
Chavarria Amalia T and Chavarria Ronald
Create a Home Valuation Report for This Property
The Home Valuation Report is an in-depth analysis detailing your home's value as well as a comparison with similar homes in the area
Home Values in the Area
Average Home Value in this Area
Purchase History
| Date | Buyer | Sale Price | Title Company |
|---|---|---|---|
| Chavarria Vickie | -- | None Available | |
| Chavarria Ronald | -- | Progressive Title | |
| Chavarria Ronald | -- | Provident Title Company | |
| Chavarria Ronald | -- | -- | |
| Chavarria Amalia T | -- | Chicago Title Insurance Co |
Source: Public Records
Mortgage History
| Date | Status | Borrower | Loan Amount |
|---|---|---|---|
| Closed | Chavarria Ronald | $180,000 | |
| Closed | Chavarria Ronald | $95,000 |
Source: Public Records
Tax History Compared to Growth
Tax History
| Year | Tax Paid | Tax Assessment Tax Assessment Total Assessment is a certain percentage of the fair market value that is determined by local assessors to be the total taxable value of land and additions on the property. | Land | Improvement |
|---|---|---|---|---|
| 2025 | $2,493 | $117,719 | $41,011 | $76,708 |
| 2024 | $2,493 | $115,411 | $40,207 | $75,204 |
| 2023 | $2,473 | $113,149 | $39,419 | $73,730 |
| 2022 | $2,396 | $110,932 | $38,647 | $72,285 |
| 2021 | $2,302 | $108,758 | $37,890 | $70,868 |
| 2019 | $2,190 | $105,534 | $36,767 | $68,767 |
| 2018 | $2,089 | $103,466 | $36,047 | $67,419 |
| 2016 | $1,993 | $99,451 | $34,649 | $64,802 |
| 2015 | $1,908 | $97,958 | $34,129 | $63,829 |
| 2014 | $1,896 | $96,040 | $33,461 | $62,579 |
Source: Public Records
Map
Nearby Homes
- 211 Peacock Ln
- 48 Primrose Ct
- 478 Sycamore Dr W
- 1155 Poppy Ct
- 1004 N Las Flores Ave
- 737 N 4th St
- 228 Mullberry Place
- 378 Mullberry Place
- 728 N 3rd St
- 1108 Poppy Ct
- 1198 Poppy Ct
- 217 Dochan Cir
- Spectrum Plan at Metro Heights - Viewpoint
- 55 Remy Ln
- 15 Remy Ln
- Apex Plan at Metro Heights - Viewpoint
- 105 Remy Ln
- 25 Remy Ln
- 605 W Lincoln Ave
- 448 Marlow Ln
- 204 W Los Amigos Ave
- 142 W Los Amigos Ave
- 208 W Los Amigos Ave
- 917 N Wemar Way
- 1008 N Wemar Way
- 138 W Los Amigos Ave
- 1011 N Wemar Way
- 916 N 2nd St
- 1012 N Wemar Way
- 212 W Los Amigos Ave
- 920 N Wemar Way
- 913 N Wemar Way
- 134 W Los Amigos Ave
- 912 N 2nd St
- 916 N Wemar Way
- 216 W Los Amigos Ave
- 219 Peacock Ln
- 130 W Los Amigos Ave
- 215 Peacock Ln
- 917 N 2nd St