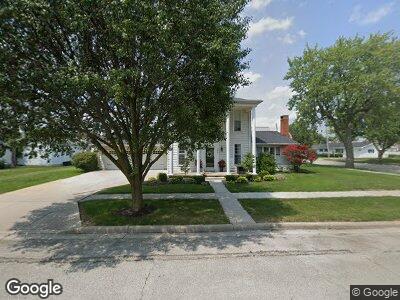
200 W Weller St Ansonia, OH 45303
Estimated Value: $148,000 - $194,000
3
Beds
2
Baths
1,952
Sq Ft
$89/Sq Ft
Est. Value
About This Home
This home is located at 200 W Weller St, Ansonia, OH 45303 and is currently estimated at $172,766, approximately $88 per square foot. 200 W Weller St is a home with nearby schools including Ansonia Elementary School, Ansonia Middle School, and Ansonia High School.
Ownership History
Date
Name
Owned For
Owner Type
Purchase Details
Closed on
Feb 21, 2018
Sold by
Siefring Theresa Beth
Bought by
Siefring Theresa Beth
Current Estimated Value
Home Financials for this Owner
Home Financials are based on the most recent Mortgage that was taken out on this home.
Interest Rate
4.38%
Purchase Details
Closed on
Nov 29, 2017
Sold by
Pnc Bank N A
Bought by
Siefring Theresa Beth and Gariety Timothy
Purchase Details
Closed on
Oct 12, 2017
Sold by
Gates Steven W and Gates Crystal H
Bought by
Pnc Bank National Association
Purchase Details
Closed on
Dec 22, 2006
Sold by
Kimmel Jacqueline S and Oliver Jacqueline S
Bought by
Gates Steven W and Gates Crystal H
Home Financials for this Owner
Home Financials are based on the most recent Mortgage that was taken out on this home.
Original Mortgage
$122,084
Interest Rate
6.24%
Mortgage Type
FHA
Purchase Details
Closed on
Jan 9, 1992
Bought by
Gates Steven W and Gates Crystal H
Create a Home Valuation Report for This Property
The Home Valuation Report is an in-depth analysis detailing your home's value as well as a comparison with similar homes in the area
Home Values in the Area
Average Home Value in this Area
Purchase History
| Date | Buyer | Sale Price | Title Company |
|---|---|---|---|
| Siefring Theresa Beth | -- | -- | |
| Siefring Theresa Beth | $64,600 | None Available | |
| Pnc Bank National Association | $52,667 | Attorney | |
| Gates Steven W | $124,000 | Attorney | |
| Gates Steven W | $65,000 | -- |
Source: Public Records
Mortgage History
| Date | Status | Borrower | Loan Amount |
|---|---|---|---|
| Open | Siefring Theresa Beth | $40,000 | |
| Closed | Siefring Theresa Beth | -- | |
| Previous Owner | Gates Steven | $35,000 | |
| Previous Owner | Gates Steven W | $122,084 |
Source: Public Records
Tax History Compared to Growth
Tax History
| Year | Tax Paid | Tax Assessment Tax Assessment Total Assessment is a certain percentage of the fair market value that is determined by local assessors to be the total taxable value of land and additions on the property. | Land | Improvement |
|---|---|---|---|---|
| 2024 | $1,645 | $48,830 | $2,360 | $46,470 |
| 2023 | $1,648 | $48,830 | $2,360 | $46,470 |
| 2022 | $1,384 | $35,170 | $1,950 | $33,220 |
| 2021 | $1,377 | $35,170 | $1,950 | $33,220 |
| 2020 | $1,383 | $35,170 | $1,950 | $33,220 |
| 2019 | $1,134 | $29,750 | $1,950 | $27,800 |
| 2018 | $1,138 | $29,750 | $1,950 | $27,800 |
| 2017 | $1,256 | $37,540 | $1,950 | $35,590 |
| 2016 | $1,258 | $34,910 | $3,960 | $30,950 |
| 2015 | $1,258 | $34,910 | $3,960 | $30,950 |
| 2014 | $1,257 | $34,910 | $3,960 | $30,950 |
| 2013 | $1,333 | $34,910 | $3,960 | $30,950 |
Source: Public Records
Map
Nearby Homes
- 8892 N State Route 49
- 5332 Tamarack Trail
- 5400 Tamarack Trail
- 7833 Greenville Celina Rd
- 7584 Ravenwood Dr
- 7302 State Route 121
- 7302 Ohio 121
- 2493 Ohio 571
- 3010 Hamilton Rd
- 790 Berkshire Dr
- 900 Manchester Dr
- 1393 Highland Dr
- 1380 Hillside Dr
- 7318 McMecham Rd
- 1243 Holly Hill Dr
- 0 Wagner Ave Unit 1033333
- 0 Wagner Ave Unit 916177
- 3163 State Route 571
- 108 Westbury Dr
- 1100 Northview Dr