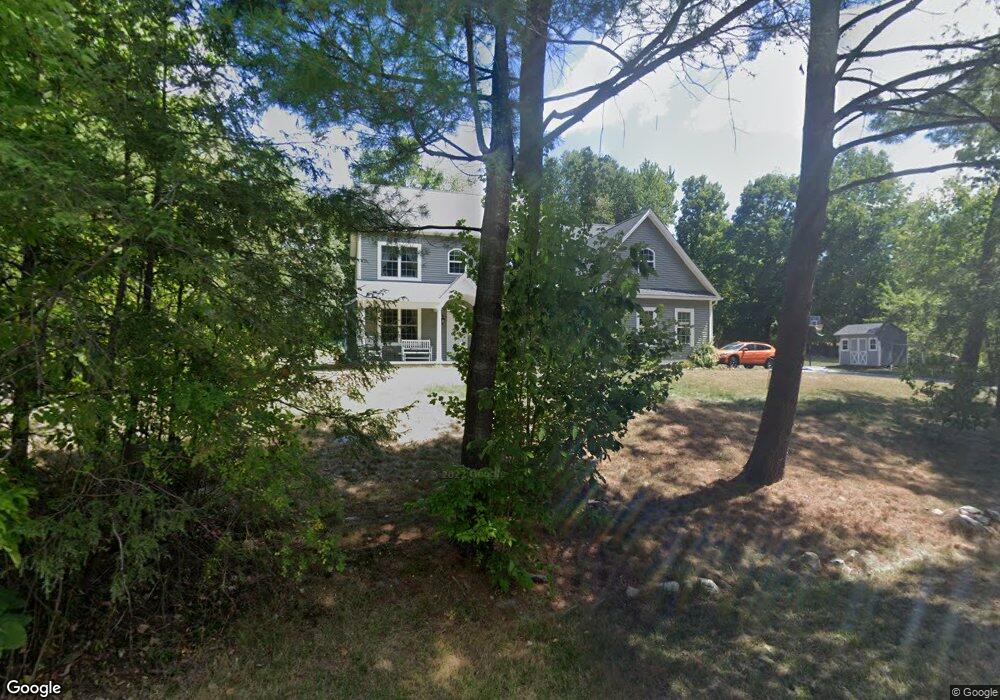
200 Windtree St Torrington, CT 06790
Estimated Value: $478,000 - $541,425
4
Beds
4
Baths
2,869
Sq Ft
$179/Sq Ft
Est. Value
About This Home
This home is located at 200 Windtree St, Torrington, CT 06790 and is currently estimated at $513,606, approximately $179 per square foot. 200 Windtree St is a home with nearby schools including Torrington Middle School, Torrington High School, and Torrington Christian Academy.
Ownership History
Date
Name
Owned For
Owner Type
Purchase Details
Closed on
Aug 27, 2014
Sold by
Szabo-Bienkowski Kris
Bought by
Hagymasi Seth A and Hagymasi Elizabeth B
Current Estimated Value
Home Financials for this Owner
Home Financials are based on the most recent Mortgage that was taken out on this home.
Original Mortgage
$268,000
Outstanding Balance
$204,429
Interest Rate
4.14%
Mortgage Type
New Conventional
Estimated Equity
$309,177
Purchase Details
Closed on
Feb 26, 2010
Sold by
Noujaim Georges M and Noujaim Luisa
Bought by
Szabo Daniel M
Purchase Details
Closed on
Sep 26, 2002
Sold by
Griffin Mary and Griffin Mark E
Bought by
Szabo Daniel
Home Financials for this Owner
Home Financials are based on the most recent Mortgage that was taken out on this home.
Original Mortgage
$56,078
Interest Rate
7.09%
Mortgage Type
Purchase Money Mortgage
Create a Home Valuation Report for This Property
The Home Valuation Report is an in-depth analysis detailing your home's value as well as a comparison with similar homes in the area
Home Values in the Area
Average Home Value in this Area
Purchase History
| Date | Buyer | Sale Price | Title Company |
|---|---|---|---|
| Hagymasi Seth A | $61,500 | -- | |
| Szabo Daniel M | -- | -- | |
| Szabo Daniel | $65,000 | -- |
Source: Public Records
Mortgage History
| Date | Status | Borrower | Loan Amount |
|---|---|---|---|
| Open | Szabo Daniel | $268,000 | |
| Previous Owner | Szabo Daniel | $8,000 | |
| Previous Owner | Szabo Daniel | $56,078 |
Source: Public Records
Tax History
| Year | Tax Paid | Tax Assessment Tax Assessment Total Assessment is a certain percentage of the fair market value that is determined by local assessors to be the total taxable value of land and additions on the property. | Land | Improvement |
|---|---|---|---|---|
| 2025 | $13,347 | $347,130 | $29,960 | $317,170 |
| 2024 | $9,429 | $196,570 | $26,250 | $170,320 |
| 2023 | $9,427 | $196,570 | $26,250 | $170,320 |
| 2022 | $9,266 | $196,570 | $26,250 | $170,320 |
| 2021 | $9,076 | $196,570 | $26,250 | $170,320 |
| 2020 | $9,076 | $196,570 | $26,250 | $170,320 |
| 2019 | $11,668 | $252,720 | $48,300 | $204,420 |
| 2018 | $11,668 | $252,720 | $48,300 | $204,420 |
| 2017 | $11,562 | $252,720 | $48,300 | $204,420 |
| 2016 | $11,562 | $252,720 | $48,300 | $204,420 |
| 2015 | $4,058 | $88,700 | $48,300 | $40,400 |
| 2014 | $2,717 | $74,810 | $74,810 | $0 |
Source: Public Records
Map
Nearby Homes
- 264 Allison Dr
- 70 Eastlawn Dr
- 144 Woodlawn Dr
- 68 Knollwood Dr
- 2495 Torringford West St
- 0 Torringford West St
- 121 Wedgewood Dr
- 1683 Torringford St
- 68 Rockledge Loop
- 91 Rockledge Loop
- 79 Rockledge Loop
- 78 Rockledge Loop
- 271 Meadowview Dr
- 1520 Torringford West St
- 143 Spyglass Ct Unit 143
- 144 Spyglass Ct
- 660 Torringford St
- 256 Albrecht Rd
- 81 Wildwood Rd
- 00 Kennedy Dr
- 225 Allison Dr
- 213 Allison Dr
- 239 Allison Dr
- 220 Windtree St
- 253 Allison Dr
- 195 Windtree St
- 199 Allison Dr
- 185 Allison Dr
- 166 Windtree St
- 265 Allison Dr
- 224 Allison Dr
- 210 Allison Dr
- 236 Allison Dr
- 196 Allison Dr
- 173 Allison Dr
- 165 Windtree St
- 250 Allison Dr
- 252 Windtree St
- 279 Allison Dr
- 76 Windtree E
Your Personal Tour Guide
Ask me questions while you tour the home.