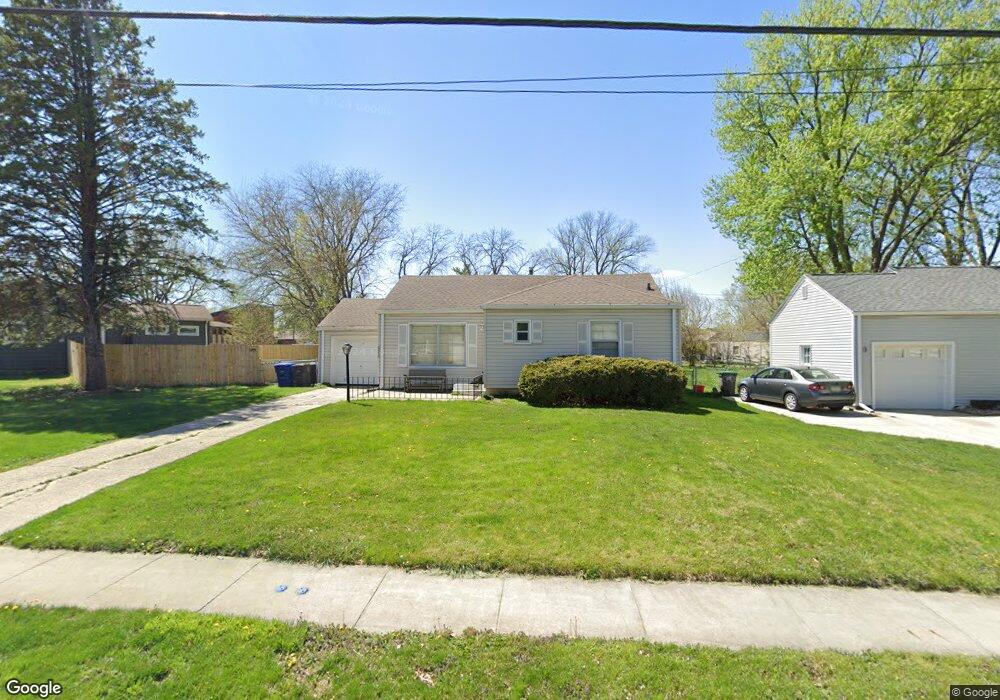
2000 56th St Des Moines, IA 50310
Merle Hay NeighborhoodEstimated Value: $210,758 - $235,000
2
Beds
1
Bath
996
Sq Ft
$222/Sq Ft
Est. Value
About This Home
This home is located at 2000 56th St, Des Moines, IA 50310 and is currently estimated at $221,190, approximately $222 per square foot. 2000 56th St is a home located in Polk County with nearby schools including Hillis Elementary School, Merrill Middle School, and Roosevelt High School.
Ownership History
Date
Name
Owned For
Owner Type
Purchase Details
Closed on
May 20, 2002
Sold by
Sayre James L and Sayre Marie K
Bought by
Ohme Robert B and Ohme Florence W
Current Estimated Value
Purchase Details
Closed on
Jun 13, 1998
Sold by
Conway Patrick David and Conway Christine Anne
Bought by
Sayre Marie K
Home Financials for this Owner
Home Financials are based on the most recent Mortgage that was taken out on this home.
Original Mortgage
$74,700
Interest Rate
7.27%
Create a Home Valuation Report for This Property
The Home Valuation Report is an in-depth analysis detailing your home's value as well as a comparison with similar homes in the area
Home Values in the Area
Average Home Value in this Area
Purchase History
| Date | Buyer | Sale Price | Title Company |
|---|---|---|---|
| Ohme Robert B | $103,000 | -- | |
| Sayre Marie K | $82,500 | -- |
Source: Public Records
Mortgage History
| Date | Status | Borrower | Loan Amount |
|---|---|---|---|
| Previous Owner | Sayre Marie K | $74,700 |
Source: Public Records
Tax History
| Year | Tax Paid | Tax Assessment Tax Assessment Total Assessment is a certain percentage of the fair market value that is determined by local assessors to be the total taxable value of land and additions on the property. | Land | Improvement |
|---|---|---|---|---|
| 2025 | $2,600 | $208,200 | $47,600 | $160,600 |
| 2024 | $2,600 | $190,000 | $42,700 | $147,300 |
| 2023 | $3,488 | $190,000 | $42,700 | $147,300 |
| 2022 | $3,460 | $156,900 | $36,500 | $120,400 |
| 2021 | $3,266 | $156,900 | $36,500 | $120,400 |
| 2020 | $3,388 | $139,500 | $32,200 | $107,300 |
| 2019 | $3,206 | $139,500 | $32,200 | $107,300 |
| 2018 | $3,168 | $127,800 | $29,000 | $98,800 |
| 2017 | $2,958 | $127,800 | $29,000 | $98,800 |
| 2016 | $2,878 | $117,900 | $26,300 | $91,600 |
| 2015 | $2,878 | $117,900 | $26,300 | $91,600 |
| 2014 | $2,752 | $112,300 | $24,700 | $87,600 |
Source: Public Records
Map
Nearby Homes
Your Personal Tour Guide
Ask me questions while you tour the home.