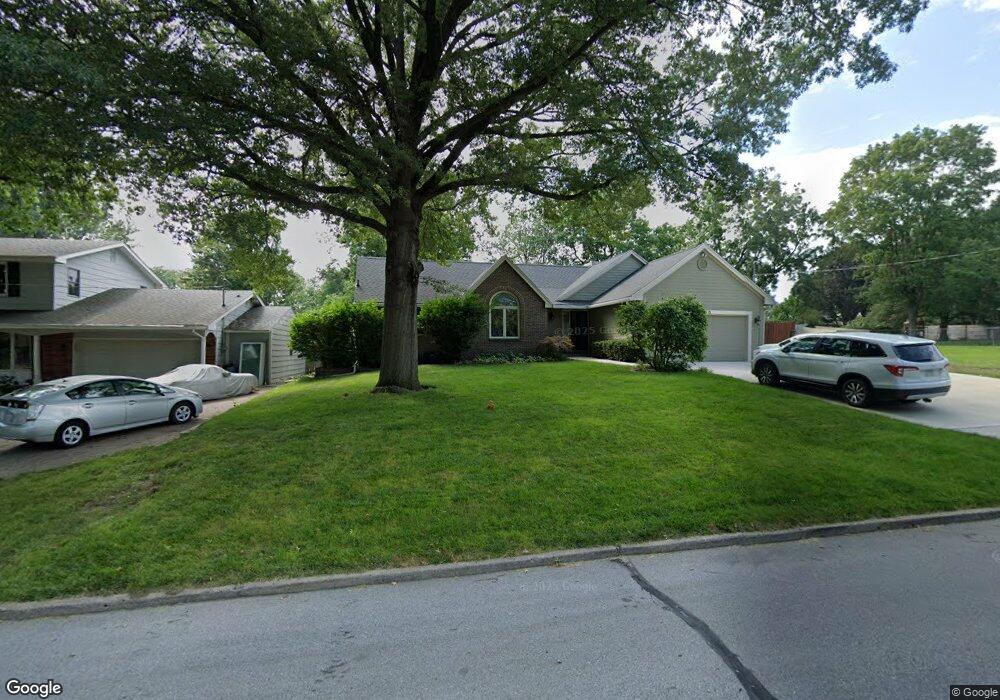
2000 69th St Windsor Heights, IA 50324
Estimated Value: $360,000 - $388,000
3
Beds
3
Baths
1,599
Sq Ft
$236/Sq Ft
Est. Value
About This Home
This home is located at 2000 69th St, Windsor Heights, IA 50324 and is currently estimated at $377,677, approximately $236 per square foot. 2000 69th St is a home located in Polk County with nearby schools including Hillis Elementary School, Merrill Middle School, and Roosevelt High School.
Ownership History
Date
Name
Owned For
Owner Type
Purchase Details
Closed on
May 20, 2019
Sold by
Davidson Douglas P and Davidson Spring
Bought by
Douglas P And Spring J Davidson Rev Tr
Current Estimated Value
Purchase Details
Closed on
Dec 22, 2005
Sold by
Vandenover David J and Vandenover Raedean K
Bought by
Davidson Douglas P and Davidson Spring
Purchase Details
Closed on
Oct 13, 1998
Sold by
Christensen Richard J and Christensen Linda E
Bought by
Vandenover David J and Vandenover Raedean K
Home Financials for this Owner
Home Financials are based on the most recent Mortgage that was taken out on this home.
Original Mortgage
$140,800
Interest Rate
6.72%
Create a Home Valuation Report for This Property
The Home Valuation Report is an in-depth analysis detailing your home's value as well as a comparison with similar homes in the area
Home Values in the Area
Average Home Value in this Area
Purchase History
| Date | Buyer | Sale Price | Title Company |
|---|---|---|---|
| Douglas P And Spring J Davidson Rev Tr | -- | None Available | |
| Davidson Douglas P | $211,500 | -- | |
| Vandenover David J | $175,500 | -- |
Source: Public Records
Mortgage History
| Date | Status | Borrower | Loan Amount |
|---|---|---|---|
| Previous Owner | Vandenover David J | $140,800 |
Source: Public Records
Tax History Compared to Growth
Tax History
| Year | Tax Paid | Tax Assessment Tax Assessment Total Assessment is a certain percentage of the fair market value that is determined by local assessors to be the total taxable value of land and additions on the property. | Land | Improvement |
|---|---|---|---|---|
| 2025 | $6,810 | $404,500 | $68,800 | $335,700 |
| 2024 | $6,810 | $380,500 | $63,700 | $316,800 |
| 2023 | $6,592 | $380,500 | $63,700 | $316,800 |
| 2022 | $6,320 | $305,500 | $52,900 | $252,600 |
| 2021 | $6,222 | $295,600 | $52,900 | $242,700 |
| 2020 | $6,478 | $268,300 | $48,000 | $220,300 |
| 2019 | $6,688 | $268,300 | $48,000 | $220,300 |
| 2018 | $6,540 | $255,700 | $43,200 | $212,500 |
| 2017 | $6,098 | $255,700 | $43,200 | $212,500 |
| 2016 | $5,778 | $231,900 | $38,300 | $193,600 |
| 2015 | $5,778 | $231,900 | $38,300 | $193,600 |
| 2014 | $5,346 | $216,100 | $35,200 | $180,900 |
Source: Public Records
Map
Nearby Homes