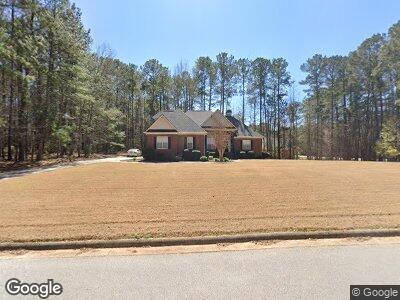
2000 Abner Place McDonough, GA 30252
Estimated Value: $385,000 - $414,006
4
Beds
3
Baths
2,446
Sq Ft
$165/Sq Ft
Est. Value
About This Home
This home is located at 2000 Abner Place, McDonough, GA 30252 and is currently estimated at $404,252, approximately $165 per square foot. 2000 Abner Place is a home located in Henry County with nearby schools including Ola Elementary School, Ola Middle School, and Ola High School.
Ownership History
Date
Name
Owned For
Owner Type
Purchase Details
Closed on
Aug 31, 2009
Sold by
Fannie Mae
Bought by
Brifnek Randy L and Brifnek Yong I
Current Estimated Value
Home Financials for this Owner
Home Financials are based on the most recent Mortgage that was taken out on this home.
Original Mortgage
$169,900
Interest Rate
5.14%
Mortgage Type
VA
Purchase Details
Closed on
Jun 2, 2009
Sold by
Jp Morgan Chase Bank Na
Bought by
Federal National Mortgage Association
Purchase Details
Closed on
Jun 23, 2000
Sold by
B & K Builders
Bought by
Foster Paul S and Foster Andrea W
Home Financials for this Owner
Home Financials are based on the most recent Mortgage that was taken out on this home.
Original Mortgage
$168,712
Interest Rate
8.63%
Mortgage Type
FHA
Create a Home Valuation Report for This Property
The Home Valuation Report is an in-depth analysis detailing your home's value as well as a comparison with similar homes in the area
Home Values in the Area
Average Home Value in this Area
Purchase History
| Date | Buyer | Sale Price | Title Company |
|---|---|---|---|
| Brifnek Randy L | -- | -- | |
| Federal National Mortgage Association | -- | -- | |
| Jp Morgan Chase Bank Na | $172,982 | -- | |
| Foster Paul S | $175,000 | -- |
Source: Public Records
Mortgage History
| Date | Status | Borrower | Loan Amount |
|---|---|---|---|
| Open | Brifnek Randy L | $183,000 | |
| Closed | -- | $156,300 | |
| Closed | Brifnek Randy L | $177,275 | |
| Closed | Brifnek Randy L | $169,900 | |
| Previous Owner | Foster Paul S | $76,000 | |
| Previous Owner | Foster Paul S | $39,000 | |
| Previous Owner | Foster Paul S | $21,200 | |
| Previous Owner | Foster Paul | $170,400 | |
| Previous Owner | Foster Paul S | $170,418 | |
| Previous Owner | Foster Paul S | $168,712 |
Source: Public Records
Tax History Compared to Growth
Tax History
| Year | Tax Paid | Tax Assessment Tax Assessment Total Assessment is a certain percentage of the fair market value that is determined by local assessors to be the total taxable value of land and additions on the property. | Land | Improvement |
|---|---|---|---|---|
| 2024 | $2,599 | $150,520 | $20,000 | $130,520 |
| 2023 | $2,083 | $152,120 | $18,800 | $133,320 |
| 2022 | $3,473 | $128,320 | $18,800 | $109,520 |
| 2021 | $3,291 | $104,000 | $18,000 | $86,000 |
| 2020 | $3,066 | $94,480 | $16,000 | $78,480 |
| 2019 | $2,977 | $90,680 | $16,000 | $74,680 |
| 2018 | $2,869 | $86,120 | $16,000 | $70,120 |
| 2016 | $2,533 | $71,920 | $12,000 | $59,920 |
| 2015 | $2,473 | $67,720 | $12,000 | $55,720 |
| 2014 | $2,259 | $61,720 | $10,000 | $51,720 |
Source: Public Records
Map
Nearby Homes
- 2000 Abner Place
- 1200 Upchurch Rd Unit 3
- 2001 Abner Place Unit 3
- 215 Abner Dr
- 215 Abner Dr Unit /355
- 1190 Upchurch Rd
- 225 Abner Dr
- 300 Monroe Dr
- 195 Abner Dr
- 1230 Upchurch Rd
- 1180 Upchurch Rd
- 235 Abner Dr Unit 3
- 290 Monroe Dr Unit 1
- 185 Abner Dr Unit 3
- 210 Abner Dr
- 1240 Upchurch Rd Unit 3
- 280 Monroe Dr
- 1170 Upchurch Rd
- 220 Abner Dr
- 305 Monroe Dr