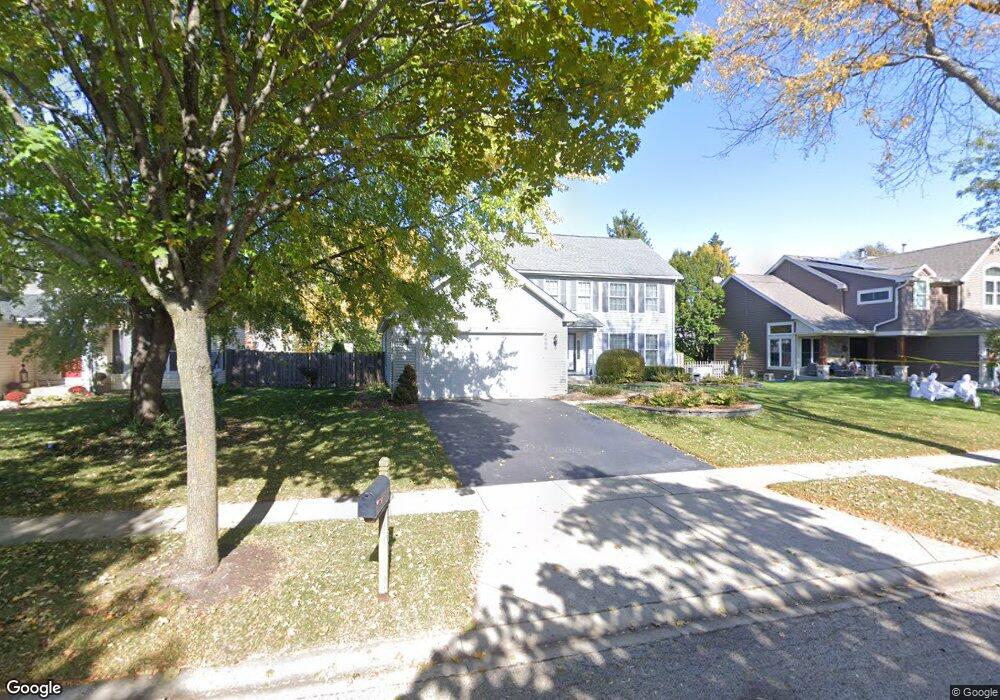
2000 Cloverdale Ln Unit 4 Algonquin, IL 60102
Estimated Value: $473,835 - $562,000
5
Beds
3
Baths
2,508
Sq Ft
$203/Sq Ft
Est. Value
About This Home
This home is located at 2000 Cloverdale Ln Unit 4, Algonquin, IL 60102 and is currently estimated at $510,209, approximately $203 per square foot. 2000 Cloverdale Ln Unit 4 is a home located in Kane County with nearby schools including Westfield Community School and Harry D Jacobs High School.
Ownership History
Date
Name
Owned For
Owner Type
Purchase Details
Closed on
Feb 28, 2011
Sold by
Osborne Ricky Alan and Osborne Denice Marie
Bought by
Drahos Paul and Drahos Jessica
Current Estimated Value
Home Financials for this Owner
Home Financials are based on the most recent Mortgage that was taken out on this home.
Original Mortgage
$226,400
Outstanding Balance
$155,998
Interest Rate
4.85%
Mortgage Type
New Conventional
Estimated Equity
$354,211
Purchase Details
Closed on
Mar 27, 2008
Sold by
Osborne Ricky Alan and Osborne Denice Marie
Bought by
Osborne Ricky Alan and Osborne Denice Marie
Purchase Details
Closed on
Jun 12, 1995
Sold by
Pack A Scott and Pack Sheila D
Bought by
Osborne Ricky A and Osborne Denice M
Home Financials for this Owner
Home Financials are based on the most recent Mortgage that was taken out on this home.
Original Mortgage
$112,000
Interest Rate
7.59%
Create a Home Valuation Report for This Property
The Home Valuation Report is an in-depth analysis detailing your home's value as well as a comparison with similar homes in the area
Purchase History
| Date | Buyer | Sale Price | Title Company |
|---|---|---|---|
| Drahos Paul | $283,000 | First United Title Services | |
| Osborne Ricky Alan | -- | None Available | |
| Osborne Ricky A | $219,000 | Chicago Title Insurance Co |
Source: Public Records
Mortgage History
| Date | Status | Borrower | Loan Amount |
|---|---|---|---|
| Open | Drahos Paul | $226,400 | |
| Previous Owner | Osborne Ricky A | $112,000 |
Source: Public Records
Tax History
| Year | Tax Paid | Tax Assessment Tax Assessment Total Assessment is a certain percentage of the fair market value that is determined by local assessors to be the total taxable value of land and additions on the property. | Land | Improvement |
|---|---|---|---|---|
| 2024 | $9,880 | $137,949 | $25,730 | $112,219 |
| 2023 | $9,451 | $124,122 | $23,151 | $100,971 |
| 2022 | $8,610 | $111,733 | $23,151 | $88,582 |
| 2021 | $8,359 | $105,498 | $21,859 | $83,639 |
| 2020 | $8,197 | $103,127 | $21,368 | $81,759 |
| 2019 | $7,949 | $97,899 | $20,285 | $77,614 |
| 2018 | $8,107 | $93,932 | $19,883 | $74,049 |
| 2017 | $7,784 | $87,869 | $18,600 | $69,269 |
| 2016 | $7,499 | $80,268 | $18,009 | $62,259 |
| 2015 | -- | $73,356 | $17,040 | $56,316 |
| 2014 | -- | $66,669 | $16,569 | $50,100 |
| 2013 | -- | $68,710 | $17,076 | $51,634 |
Source: Public Records
Map
Nearby Homes
- 20 Peach Tree Ct Unit 4153
- 18 Peach Tree Ct Unit 4154
- 2069 Peach Tree Ln Unit 4116
- 1900 Waverly Ln
- 2051 Carlisle St
- 1239 Glenmont St
- 1141 Glenmont St
- 1033 Interloch Ct Unit 32
- 2224 Barrett Dr
- 1002 Interloch Ct Unit 152
- 350 Coldsprings St
- 1157 Sawmill Ln
- 1090 Glenmont St
- 1247 Glenmont St
- 1250 Glenmont St
- 1241 Glenmont St
- 1111 Glenmont St
- 1243 Glenmont St
- 1080 Glenmont St
- 1030 Glenmont St
- 2010 Cloverdale Ln Unit 4
- 1980 Cloverdale Ln
- 1981 Peach Tree Ln Unit 3
- 2020 Cloverdale Ln
- 1970 Cloverdale Ln
- 1710 Arbordale Ln Unit 4
- 1961 Peach Tree Ln
- 2001 Peach Tree Ln
- 1711 Arbordale Ln
- 2030 Cloverdale Ln
- 1960 Cloverdale Ln
- 2021 Cloverdale Ln
- 1951 Peach Tree Ln
- 1720 Arbordale Ln
- 1721 Arbordale Ln
- 2011 Peach Tree Ln
- 2031 Cloverdale Ln
- 2040 Cloverdale Ln
- 1710 Waverly Ln
- 1950 Cloverdale Ln
Your Personal Tour Guide
Ask me questions while you tour the home.