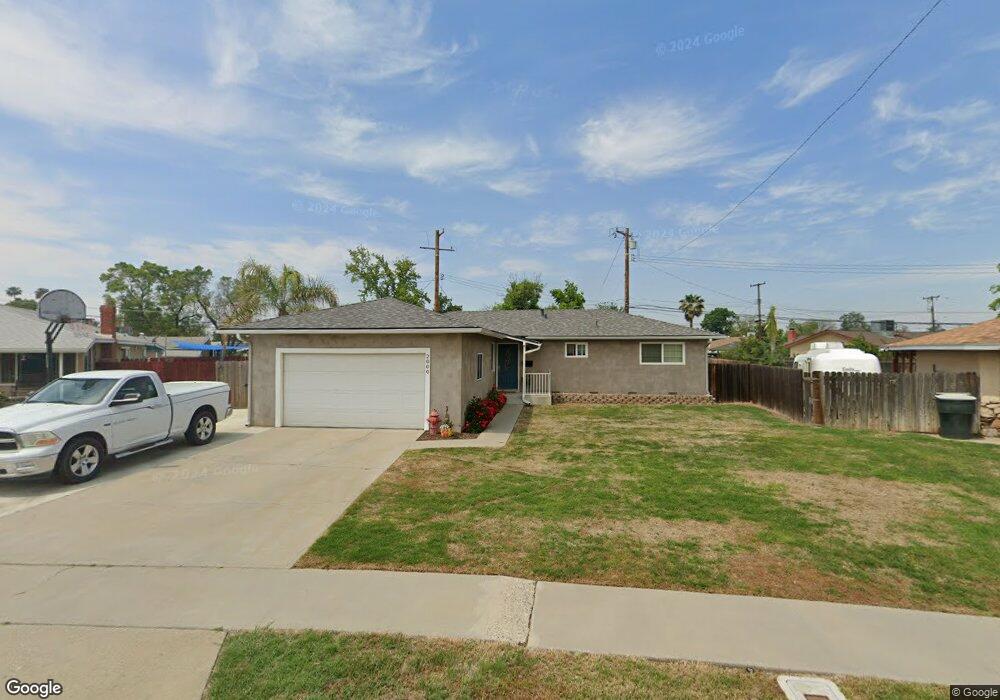
2000 N Burl Dr Hanford, CA 93230
Estimated Value: $292,000 - $314,000
3
Beds
1
Bath
1,350
Sq Ft
$225/Sq Ft
Est. Value
About This Home
This home is located at 2000 N Burl Dr, Hanford, CA 93230 and is currently estimated at $303,630, approximately $224 per square foot. 2000 N Burl Dr is a home located in Kings County with nearby schools including George Washington Elementary School, John F. Kennedy Junior High School, and Hanford High School.
Ownership History
Date
Name
Owned For
Owner Type
Purchase Details
Closed on
Aug 11, 2016
Sold by
Fahlsing Tracy L
Bought by
Fahlsing Tracy L and Fahlsing Jeremy
Current Estimated Value
Home Financials for this Owner
Home Financials are based on the most recent Mortgage that was taken out on this home.
Original Mortgage
$119,500
Outstanding Balance
$54,605
Interest Rate
3.45%
Mortgage Type
New Conventional
Estimated Equity
$249,025
Purchase Details
Closed on
Mar 31, 2005
Sold by
Fahlsing Tracy L and Stivers Tracy L
Bought by
Fahlsing Tracy L
Home Financials for this Owner
Home Financials are based on the most recent Mortgage that was taken out on this home.
Original Mortgage
$153,964
Interest Rate
5.7%
Mortgage Type
New Conventional
Purchase Details
Closed on
Nov 12, 2001
Sold by
Stivers Tracy L
Bought by
Stivers Tracy L
Home Financials for this Owner
Home Financials are based on the most recent Mortgage that was taken out on this home.
Original Mortgage
$88,350
Interest Rate
6.63%
Mortgage Type
Balloon
Purchase Details
Closed on
Nov 6, 2000
Sold by
Stivers Russell
Bought by
Stivers Tracy L
Home Financials for this Owner
Home Financials are based on the most recent Mortgage that was taken out on this home.
Original Mortgage
$82,650
Interest Rate
7.82%
Create a Home Valuation Report for This Property
The Home Valuation Report is an in-depth analysis detailing your home's value as well as a comparison with similar homes in the area
Home Values in the Area
Average Home Value in this Area
Purchase History
| Date | Buyer | Sale Price | Title Company |
|---|---|---|---|
| Fahlsing Tracy L | -- | Chicago Title Company | |
| Fahlsing Tracy L | -- | -- | |
| Stivers Tracy L | -- | First American Title Co | |
| Stivers Tracy L | -- | Chicago Title Co | |
| Stivers Tracy L | $87,000 | Chicago Title Co |
Source: Public Records
Mortgage History
| Date | Status | Borrower | Loan Amount |
|---|---|---|---|
| Open | Fahlsing Tracy L | $119,500 | |
| Closed | Fahlsing Tracy L | $153,964 | |
| Closed | Stivers Tracy L | $88,350 | |
| Closed | Stivers Tracy L | $82,650 |
Source: Public Records
Tax History Compared to Growth
Tax History
| Year | Tax Paid | Tax Assessment Tax Assessment Total Assessment is a certain percentage of the fair market value that is determined by local assessors to be the total taxable value of land and additions on the property. | Land | Improvement |
|---|---|---|---|---|
| 2025 | $1,337 | $133,083 | $45,209 | $87,874 |
| 2023 | $1,337 | $127,916 | $43,454 | $84,462 |
| 2022 | $1,306 | $125,408 | $42,602 | $82,806 |
| 2021 | $1,276 | $122,950 | $41,767 | $81,183 |
| 2020 | $1,289 | $121,690 | $41,339 | $80,351 |
| 2019 | $1,266 | $119,303 | $40,528 | $78,775 |
| 2018 | $1,228 | $116,963 | $39,733 | $77,230 |
| 2017 | $1,208 | $114,670 | $38,954 | $75,716 |
| 2016 | $1,190 | $112,421 | $38,190 | $74,231 |
| 2015 | $1,182 | $110,732 | $37,616 | $73,116 |
| 2014 | $1,157 | $108,563 | $36,879 | $71,684 |
Source: Public Records
Map
Nearby Homes
- 2015 N Burl Dr
- 1901 N Kensington Way
- 2055 N Burl Dr
- 344 E Lemmon Way
- 109 Lorita Way
- 325 E Amber Way
- 136 W Colonial Dr
- 841 Moffat Dr
- 1807 Hardcastle Ave
- 405 E Magnolia Ave
- 129 E Grangeville Blvd
- 852 E Grangeville Blvd Unit 98
- 852 E Grangeville Blvd Unit 6
- 117 E Grangeville Blvd
- 98 E Grangeville Blvd
- 23 E Grangeville Blvd
- 240 W Terrace Dr
- 14 W Grangeville Blvd
- 2234 Carter Way
- 225 W Colonial Dr
- 1920 N Burl Dr
- 2001 N Kensington Way
- 2005 N Kensington Way
- 2005 Fairmont Dr
- 1939 N Kensington Way
- 2008 N Burl Dr
- 1916 N Burl Dr
- 2001 N Burl Dr
- 2009 Fairmont Dr
- 1935 N Kensington Way
- 1917 N Burl Dr
- 2013 N Kensington Way
- 2012 N Burl Dr
- 1912 N Burl Dr
- 2005 N Burl Dr
- 1913 N Burl Dr
- 1931 N Kensington Way
- 2013 Fairmont Dr
- 2009 N Burl Dr
- 2014 N Burl Dr