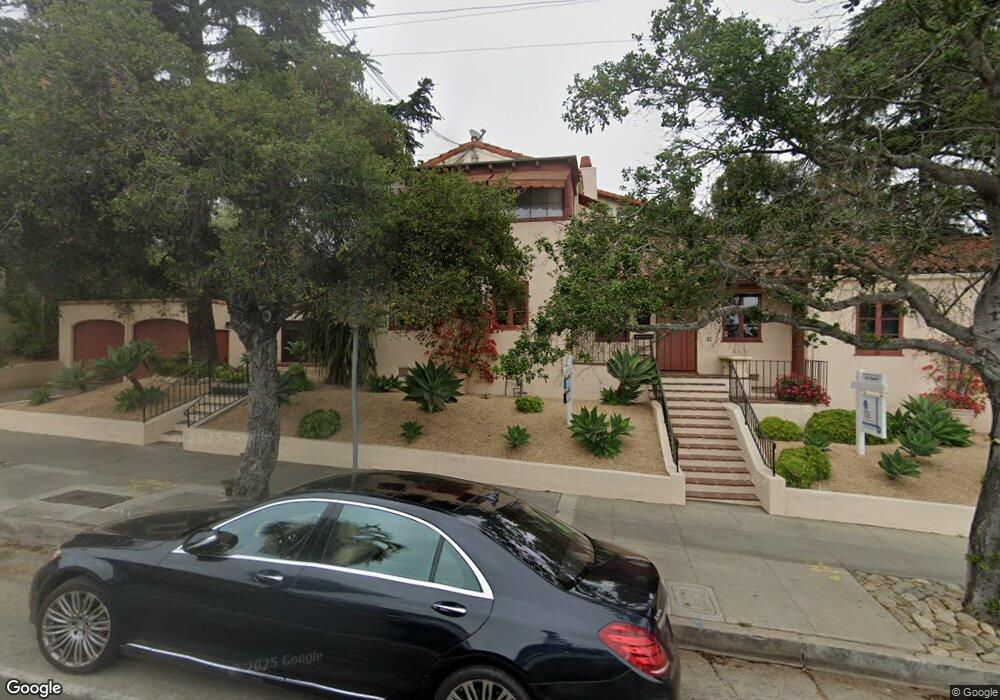
2000 State St Unit A Santa Barbara, CA 93105
Oak Park Neighborhood
3
Beds
2
Baths
2,228
Sq Ft
6,534
Sq Ft Lot
About This Home
This home is located at 2000 State St Unit A, Santa Barbara, CA 93105. 2000 State St Unit A is a home located in Santa Barbara County with nearby schools including Roosevelt Elementary School, Santa Barbara Junior High School, and Santa Barbara Senior High School.
Ownership History
Date
Name
Owned For
Owner Type
Purchase Details
Closed on
Jul 26, 2006
Sold by
Herold Maria and Moretti Maria
Bought by
Herold George and Herold Maria F
Home Financials for this Owner
Home Financials are based on the most recent Mortgage that was taken out on this home.
Original Mortgage
$562,520
Outstanding Balance
$334,228
Interest Rate
6.57%
Mortgage Type
Commercial
Purchase Details
Closed on
Jul 19, 2006
Sold by
Moretti Peter and Herold George
Bought by
Foley Thomas G and Foley Patricia S
Home Financials for this Owner
Home Financials are based on the most recent Mortgage that was taken out on this home.
Original Mortgage
$562,520
Outstanding Balance
$334,228
Interest Rate
6.57%
Mortgage Type
Commercial
Purchase Details
Closed on
Jul 17, 2006
Sold by
Moretti Johanna T
Bought by
Moretti Peter and Moretti Peter M
Home Financials for this Owner
Home Financials are based on the most recent Mortgage that was taken out on this home.
Original Mortgage
$562,520
Outstanding Balance
$334,228
Interest Rate
6.57%
Mortgage Type
Commercial
Create a Home Valuation Report for This Property
The Home Valuation Report is an in-depth analysis detailing your home's value as well as a comparison with similar homes in the area
Home Values in the Area
Average Home Value in this Area
Purchase History
| Date | Buyer | Sale Price | Title Company |
|---|---|---|---|
| Herold George | -- | Stewart Title Of Ca Inc | |
| Foley Thomas G | $1,514,500 | Stewart Title Of Ca Inc | |
| Moretti Peter | -- | Stewart Title Of Ca Inc |
Source: Public Records
Mortgage History
| Date | Status | Borrower | Loan Amount |
|---|---|---|---|
| Open | Moretti Peter | $562,520 | |
| Closed | Foley Thomas G | $562,520 | |
| Closed | Herold George | $460,243 | |
| Closed | Foley Thomas G | $460,243 | |
| Closed | Moretti Peter | $460,243 |
Source: Public Records
Tax History
| Year | Tax Paid | Tax Assessment Tax Assessment Total Assessment is a certain percentage of the fair market value that is determined by local assessors to be the total taxable value of land and additions on the property. | Land | Improvement |
|---|---|---|---|---|
| 2025 | $13,967 | $1,339,775 | $991,438 | $348,337 |
| 2023 | $13,967 | $1,287,752 | $952,941 | $334,811 |
| 2022 | $13,477 | $1,262,503 | $934,256 | $328,247 |
| 2021 | $13,165 | $1,237,749 | $915,938 | $321,811 |
| 2020 | $13,029 | $1,225,059 | $906,547 | $318,512 |
| 2019 | $12,802 | $1,201,039 | $888,772 | $312,267 |
| 2018 | $12,621 | $1,177,491 | $871,346 | $306,145 |
| 2017 | $12,204 | $1,154,404 | $854,261 | $300,143 |
| 2016 | $11,939 | $1,131,769 | $837,511 | $294,258 |
| 2014 | $11,615 | $1,092,933 | $808,772 | $284,161 |
Source: Public Records
Map
Nearby Homes
- 15 W Padre St
- 1831 Chapala St
- 1917 Bath St
- 1600 Santa Barbara St
- 316 W Valerio
- 9 E Quinto St
- 1600 Garden St Unit 32
- 103 E Micheltorena St
- 233 W Quinto St
- 513 E Pedregosa St
- 2117 Oak Park Ln
- 514 E Islay St Unit A & B
- 518 E Islay St
- 1428 De la Vina St
- 2535 De la Vina St
- 1803 Grand Ave
- 601 Eucalyptus Ave
- 1750 Prospect Ave
- 2430 Fletcher Ave
- 1416 Bath St
- 2000 State St Unit C
- 2000 State St Unit B
- 7 E Mission St Unit A
- 2014 State St
- 9 E Mission St
- 2016&2020 State St
- 2016 State St
- 2008 State St
- 19 Mission
- 19 E Mission St Unit A
- 19 E Mission St
- 2030 State #24 St Unit 24
- 2030 State Apt 25 St
- 2015 State St
- 2030 State #22 Unit 22
- 2019 State St
- 2030 State #20 Unit 20
- 21 E Mission St
- 2011 State St
- 2021 State St
Your Personal Tour Guide
Ask me questions while you tour the home.