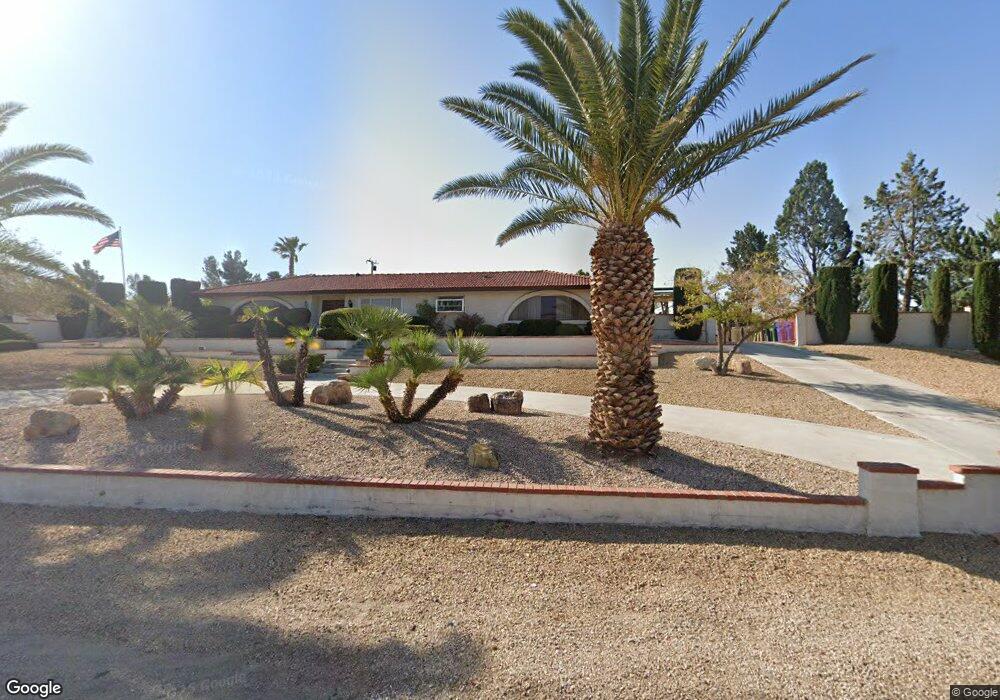
20007 Eyota Rd Apple Valley, CA 92308
High Desert NeighborhoodEstimated Value: $617,000 - $762,000
4
Beds
3
Baths
3,628
Sq Ft
$188/Sq Ft
Est. Value
About This Home
This home is located at 20007 Eyota Rd, Apple Valley, CA 92308 and is currently estimated at $683,373, approximately $188 per square foot. 20007 Eyota Rd is a home located in San Bernardino County with nearby schools including Sitting Bull Academy, Apple Valley High School, and Apple Valley Christian.
Ownership History
Date
Name
Owned For
Owner Type
Purchase Details
Closed on
Mar 25, 2016
Sold by
Doran Patrick R and Doran Tamra L
Bought by
2016 T & P Doran Trust
Current Estimated Value
Purchase Details
Closed on
Mar 22, 1999
Sold by
Federal Home Loan Mortgage Corporation
Bought by
Doran Patrick R and Doran Tamra L
Home Financials for this Owner
Home Financials are based on the most recent Mortgage that was taken out on this home.
Original Mortgage
$209,400
Outstanding Balance
$50,852
Interest Rate
6.79%
Estimated Equity
$632,521
Purchase Details
Closed on
Nov 30, 1998
Sold by
Hartman Robert D and Hartman Barbara J
Bought by
Federal Home Loan Mortgage Corporation
Purchase Details
Closed on
Mar 25, 1996
Sold by
Delucia Rose and Delucia Richard A
Bought by
Hartman Robert D and Hartman Barbara J
Home Financials for this Owner
Home Financials are based on the most recent Mortgage that was taken out on this home.
Original Mortgage
$162,000
Interest Rate
7.41%
Create a Home Valuation Report for This Property
The Home Valuation Report is an in-depth analysis detailing your home's value as well as a comparison with similar homes in the area
Home Values in the Area
Average Home Value in this Area
Purchase History
| Date | Buyer | Sale Price | Title Company |
|---|---|---|---|
| 2016 T & P Doran Trust | -- | None Available | |
| Doran Patrick R | $216,000 | First American Title Co | |
| Federal Home Loan Mortgage Corporation | $170,097 | Landsafe Title | |
| Hartman Robert D | $180,000 | First American Title Ins Co |
Source: Public Records
Mortgage History
| Date | Status | Borrower | Loan Amount |
|---|---|---|---|
| Open | Doran Patrick R | $209,400 | |
| Previous Owner | Hartman Robert D | $162,000 |
Source: Public Records
Tax History
| Year | Tax Paid | Tax Assessment Tax Assessment Total Assessment is a certain percentage of the fair market value that is determined by local assessors to be the total taxable value of land and additions on the property. | Land | Improvement |
|---|---|---|---|---|
| 2025 | $3,868 | $338,475 | $57,540 | $280,935 |
| 2024 | $3,757 | $331,838 | $56,412 | $275,426 |
| 2023 | $3,722 | $325,331 | $55,306 | $270,025 |
| 2022 | $3,665 | $318,952 | $54,222 | $264,730 |
| 2021 | $3,579 | $312,698 | $53,159 | $259,539 |
| 2020 | $3,536 | $309,492 | $52,614 | $256,878 |
| 2019 | $3,469 | $303,423 | $51,582 | $251,841 |
| 2018 | $3,382 | $297,474 | $50,571 | $246,903 |
| 2017 | $3,335 | $291,641 | $49,579 | $242,062 |
| 2016 | $3,219 | $285,923 | $48,607 | $237,316 |
| 2015 | $3,170 | $281,628 | $47,877 | $233,751 |
| 2014 | $3,127 | $276,111 | $46,939 | $229,172 |
Source: Public Records
Map
Nearby Homes
- 19978 Eyota Rd
- 13519 Sunset Dr
- 20136 Ottawa Rd
- 19783 Lara Ln
- 13311 Choco Rd
- 13167 Olathe Rd
- 19924 Sunset Ln
- 13288 Choco Rd
- 20190 Osseo Rd
- 20385 Eyota Rd
- 20219 Osseo Rd
- 13114 Choco Rd
- 20357 Ituma Rd
- 23766 Valley View Ct
- 13027 Quapaw Rd
- 13934 Okesa Rd
- 13954 Cronese Rd
- 0 Shawnee Rd Unit HD25098149
- 13099 Pocono Rd
- 14024 Delaware Rd
- 19991 Eyota Rd
- 20021 Eyota Rd
- 20058 Waco Rd
- 19996 Eyota Rd
- 20018 Eyota Rd
- 20064 Waco Rd
- 20029 Eyota Rd
- 20046 Waco Rd
- 20026 Waco Rd
- 20038 Eyota Rd
- 13461 Cronese Rd
- 13428 Cronese Rd
- 20056 Eyota Rd
- 20070 Waco Rd
- 13420 Rincon Rd
- 20014 Waco Rd
- 13442 Rincon Rd
- 13504 Itasca Ct
- 13483 Cronese Rd
- 13464 Cronese Rd
Your Personal Tour Guide
Ask me questions while you tour the home.