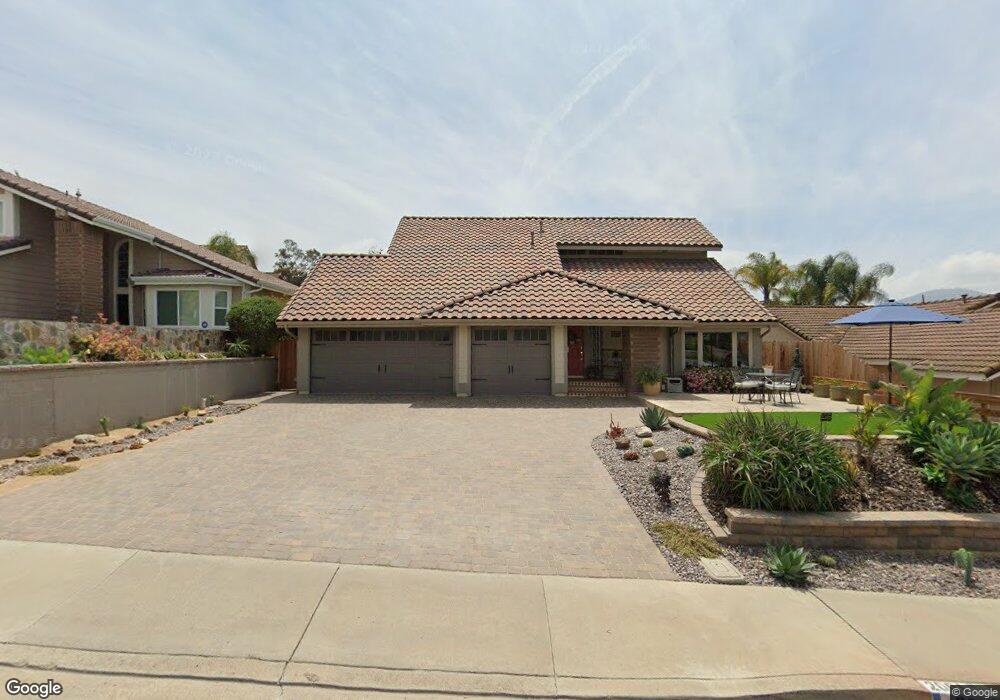
2001 Aspen Ln El Cajon, CA 92019
Rancho Park NeighborhoodEstimated Value: $1,009,928 - $1,181,000
4
Beds
3
Baths
1,980
Sq Ft
$539/Sq Ft
Est. Value
About This Home
This home is located at 2001 Aspen Ln, El Cajon, CA 92019 and is currently estimated at $1,067,482, approximately $539 per square foot. 2001 Aspen Ln is a home located in San Diego County with nearby schools including Vista Grande Elementary, Hillsdale Middle School, and Valhalla High.
Ownership History
Date
Name
Owned For
Owner Type
Purchase Details
Closed on
Nov 10, 1998
Sold by
Mclean David L and Mclean Katherine W
Bought by
Krizmanic Carole Ann and West Thomas R
Current Estimated Value
Home Financials for this Owner
Home Financials are based on the most recent Mortgage that was taken out on this home.
Original Mortgage
$242,900
Outstanding Balance
$52,368
Interest Rate
6.45%
Estimated Equity
$1,015,114
Purchase Details
Closed on
Mar 2, 1994
Sold by
Sink Steven R and Sink Christine D
Bought by
Mclean David L and Mclean Katherine W
Home Financials for this Owner
Home Financials are based on the most recent Mortgage that was taken out on this home.
Original Mortgage
$187,000
Interest Rate
4.12%
Purchase Details
Closed on
Mar 28, 1988
Purchase Details
Closed on
Oct 25, 1984
Create a Home Valuation Report for This Property
The Home Valuation Report is an in-depth analysis detailing your home's value as well as a comparison with similar homes in the area
Home Values in the Area
Average Home Value in this Area
Purchase History
| Date | Buyer | Sale Price | Title Company |
|---|---|---|---|
| Krizmanic Carole Ann | $270,000 | California Title Company | |
| Mclean David L | $220,000 | Fidelity National Title | |
| -- | $173,000 | -- | |
| -- | $110,000 | -- |
Source: Public Records
Mortgage History
| Date | Status | Borrower | Loan Amount |
|---|---|---|---|
| Open | Krizmanic Carole Ann | $242,900 | |
| Previous Owner | Mclean David L | $187,000 |
Source: Public Records
Tax History
| Year | Tax Paid | Tax Assessment Tax Assessment Total Assessment is a certain percentage of the fair market value that is determined by local assessors to be the total taxable value of land and additions on the property. | Land | Improvement |
|---|---|---|---|---|
| 2025 | $5,152 | $423,096 | $153,849 | $269,247 |
| 2024 | $5,152 | $414,801 | $150,833 | $263,968 |
| 2023 | $5,017 | $406,669 | $147,876 | $258,793 |
| 2022 | $4,932 | $398,696 | $144,977 | $253,719 |
| 2021 | $4,864 | $390,880 | $142,135 | $248,745 |
| 2020 | $4,772 | $386,873 | $140,678 | $246,195 |
| 2019 | $4,714 | $379,288 | $137,920 | $241,368 |
| 2018 | $4,637 | $371,852 | $135,216 | $236,636 |
| 2017 | $594 | $364,562 | $132,565 | $231,997 |
| 2016 | $4,399 | $357,415 | $129,966 | $227,449 |
| 2015 | $4,368 | $352,047 | $128,014 | $224,033 |
| 2014 | $4,284 | $345,152 | $125,507 | $219,645 |
Source: Public Records
Map
Nearby Homes
- 1818 Sonett St
- 2026 Capri Ct
- 2552 Wind River Rd
- 2846 Willow Glen Dr
- 2049 Wind River Rd
- 2075 Pierce Ct
- 2450 Sawgrass St
- 12092 Calle de Leon Unit 45
- 1810 Hillsdale Rd Unit 94
- 2011 Monarch Ridge Cir
- 1912 Jalisco Rd
- 12083 Calle de Montana Unit 219
- 1975 Julianna St
- 12046 Calle de Montana Unit 274
- 0 Hillsdale Rd Unit PTP2601192
- 11438 Via Rancho San Diego Unit 141
- 3206 Rancho Diego Cir
- 11992 Avenida Marcella
- 11358 Via Rancho San Diego
- 1525 Fair Glen Rd
- 2009 Aspen Ln
- 1945 Aspen Ln
- 2321 Wind River Rd
- 2325 Wind River Rd
- 1941 Aspen Ln
- 2317 Wind River Rd
- 2017 Aspen Ln
- 2329 Wind River Rd
- 2002 Aspen Ln
- 2313 Wind River Rd
- 1937 Aspen Ln
- 2016 Aspen Ln
- 1942 Aspen Ln
- 2025 Aspen Ln
- 2333 Wind River Rd
- 2309 Wind River Rd
- 1938 Aspen Ln
- 2028 Aspen Ln
- 1935 Aspen Ln
- 2009 Lacava Place
Your Personal Tour Guide
Ask me questions while you tour the home.