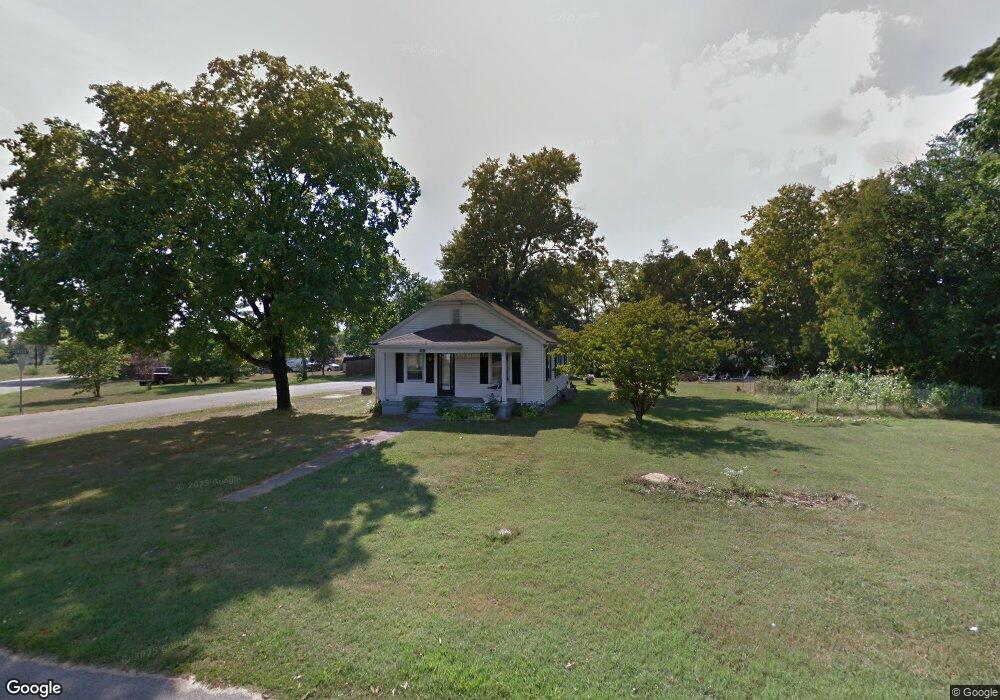
2001 Clark St Hamilton, OH 45011
Estimated Value: $138,000 - $198,000
3
Beds
1
Bath
974
Sq Ft
$162/Sq Ft
Est. Value
About This Home
This home is located at 2001 Clark St, Hamilton, OH 45011 and is currently estimated at $157,407, approximately $161 per square foot. 2001 Clark St is a home located in Butler County with nearby schools including New Miami Elementary School, New Miami Middle School, and New Miami High School.
Ownership History
Date
Name
Owned For
Owner Type
Purchase Details
Closed on
Jul 23, 2007
Sold by
Foster Rachel E and Foster Doug
Bought by
Gibson Ronald C
Current Estimated Value
Home Financials for this Owner
Home Financials are based on the most recent Mortgage that was taken out on this home.
Original Mortgage
$102,000
Outstanding Balance
$63,312
Interest Rate
6.73%
Mortgage Type
Unknown
Estimated Equity
$94,095
Purchase Details
Closed on
Aug 17, 2000
Sold by
Perry Stephen T
Bought by
Dawson Rachel E and Perry Rachel E
Home Financials for this Owner
Home Financials are based on the most recent Mortgage that was taken out on this home.
Original Mortgage
$82,300
Interest Rate
11.42%
Mortgage Type
Purchase Money Mortgage
Purchase Details
Closed on
Aug 28, 1995
Sold by
Clemmons Delmas
Bought by
Perry Stephen T and Perry Rachel
Home Financials for this Owner
Home Financials are based on the most recent Mortgage that was taken out on this home.
Original Mortgage
$66,500
Interest Rate
7.43%
Mortgage Type
New Conventional
Purchase Details
Closed on
Mar 1, 1985
Create a Home Valuation Report for This Property
The Home Valuation Report is an in-depth analysis detailing your home's value as well as a comparison with similar homes in the area
Home Values in the Area
Average Home Value in this Area
Purchase History
We collect this data history from publicly available records. To have your information removed, we recommend requesting removal directly through your county’s website.
| Date | Buyer | Sale Price | Title Company |
|---|---|---|---|
| Gibson Ronald C | $102,000 | Republic Title Agency Inc | |
| Dawson Rachel E | -- | Acs Title & Closing Services | |
| Perry Stephen T | $70,000 | -- | |
| -- | $38,000 | -- |
Source: Public Records
Mortgage History
We collect this data history from publicly available records. To have your information removed, we recommend requesting removal directly through your county’s website.
| Date | Status | Borrower | Loan Amount |
|---|---|---|---|
| Open | Gibson Ronald C | $102,000 | |
| Previous Owner | Dawson Rachel E | $82,300 | |
| Previous Owner | Perry Stephen T | $66,500 |
Source: Public Records
Tax History
| Year | Tax Paid | Tax Assessment Tax Assessment Total Assessment is a certain percentage of the fair market value that is determined by local assessors to be the total taxable value of land and additions on the property. | Land | Improvement |
|---|---|---|---|---|
| 2025 | $1,401 | $31,180 | $7,060 | $24,120 |
| 2024 | $1,401 | $31,180 | $7,060 | $24,120 |
| 2023 | $1,388 | $31,180 | $7,060 | $24,120 |
| 2022 | $1,294 | $24,740 | $7,060 | $17,680 |
| 2021 | $1,320 | $24,740 | $7,060 | $17,680 |
| 2020 | $1,368 | $24,740 | $7,060 | $17,680 |
| 2019 | $1,027 | $20,330 | $6,780 | $13,550 |
| 2018 | $1,235 | $20,330 | $6,780 | $13,550 |
| 2017 | $1,266 | $20,330 | $6,780 | $13,550 |
| 2016 | $1,255 | $20,330 | $6,780 | $13,550 |
| 2015 | $838 | $20,330 | $6,780 | $13,550 |
| 2014 | $857 | $20,330 | $6,780 | $13,550 |
| 2013 | $857 | $16,800 | $5,490 | $11,310 |
Source: Public Records
Map
Nearby Homes
- 1972 John St
- 1913 Saint Clair St
- 1950 Williams St
- 0 Hamilton Eaton Rd
- 0 Hamilton Eaton Rd Unit 1830987
- 243 Whitaker Ave
- 107 S Riverside Dr
- 30 Seven Mile Ave
- 2477 Maple St
- 44 Martin Ave
- 264 Howman Ave
- 2678 Jackson Rd
- 4483 N Riverside Dr
- 3112 Calusa Dr
- 1776 Thall Dr
- 1364 Cotswold Ln Unit 1364
- 1416 Cotswold Ln Unit 1416
- 5569 Echo Springs Dr
- 1434 Cotswold Ln Unit 1434
- 3290 Springcrest Dr
Your Personal Tour Guide
Ask me questions while you tour the home.