Estimated Value: $189,736 - $343,000
4
Beds
1
Bath
1,788
Sq Ft
$134/Sq Ft
Est. Value
About This Home
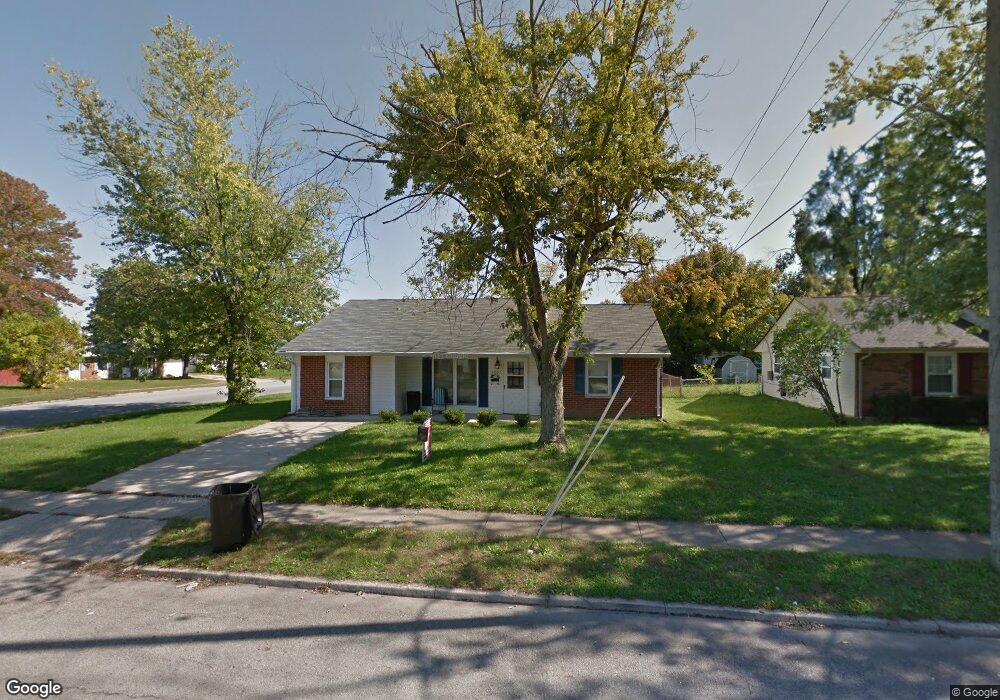
This home is located at 2001 Commonwealth Dr, Xenia, OH 45385 and is currently estimated at $239,934, approximately $134 per square foot. 2001 Commonwealth Dr is a home located in Greene County with nearby schools including Xenia High School, Summit Academy Community School for Alternative Learners - Xenia, and Legacy Christian Academy.
Ownership History
Date
Name
Owned For
Owner Type
Purchase Details
Closed on
Jan 24, 2024
Sold by
Anger Scott J
Bought by
Ohio Valley Property Mgmt Llc
Current Estimated Value
Purchase Details
Closed on
Dec 19, 2023
Sold by
Sheriff Of Greene County
Bought by
Ohio Valley Property Mgmt Llc
Purchase Details
Closed on
Mar 22, 2014
Sold by
Dinehart Joel W and Dinehart Heidi
Bought by
Wooley Sharon K
Home Financials for this Owner
Home Financials are based on the most recent Mortgage that was taken out on this home.
Original Mortgage
$84,442
Interest Rate
4.5%
Mortgage Type
FHA
Purchase Details
Closed on
Oct 26, 2005
Sold by
Phillips James E and Phillips Faith M
Bought by
Dinehart Joel W and Dinehart Heidi
Home Financials for this Owner
Home Financials are based on the most recent Mortgage that was taken out on this home.
Original Mortgage
$91,850
Interest Rate
5.8%
Mortgage Type
Fannie Mae Freddie Mac
Create a Home Valuation Report for This Property
The Home Valuation Report is an in-depth analysis detailing your home's value as well as a comparison with similar homes in the area
Home Values in the Area
Average Home Value in this Area
Purchase History
| Date | Buyer | Sale Price | Title Company |
|---|---|---|---|
| Ohio Valley Property Mgmt Llc | $57,000 | None Listed On Document | |
| Ohio Valley Property Mgmt Llc | $57,000 | None Listed On Document | |
| Wooley Sharon K | $86,000 | None Available | |
| Dinehart Joel W | $118,500 | -- |
Source: Public Records
Mortgage History
| Date | Status | Borrower | Loan Amount |
|---|---|---|---|
| Previous Owner | Wooley Sharon K | $84,442 | |
| Previous Owner | Dinehart Joel W | $91,850 |
Source: Public Records
Tax History Compared to Growth
Tax History
| Year | Tax Paid | Tax Assessment Tax Assessment Total Assessment is a certain percentage of the fair market value that is determined by local assessors to be the total taxable value of land and additions on the property. | Land | Improvement |
|---|---|---|---|---|
| 2024 | $510 | $11,920 | $11,920 | $0 |
| 2023 | $510 | $11,920 | $11,920 | $0 |
| 2022 | $2,652 | $7,010 | $7,010 | $0 |
| 2021 | $15,977 | $43,520 | $7,010 | $36,510 |
| 2020 | $9,894 | $43,520 | $7,010 | $36,510 |
| 2019 | $1,803 | $34,850 | $6,870 | $27,980 |
| 2018 | $1,810 | $34,850 | $6,870 | $27,980 |
| 2017 | $1,758 | $34,850 | $6,870 | $27,980 |
| 2016 | $1,630 | $30,790 | $6,870 | $23,920 |
| 2015 | $1,634 | $30,790 | $6,870 | $23,920 |
| 2014 | $1,522 | $30,790 | $6,870 | $23,920 |
Source: Public Records
Map
Nearby Homes
- 1866 Roxbury Dr
- 1255 Colorado Dr
- 1908 Whitt St
- 1107 Arkansas Dr
- 1403 Texas Dr
- 2499 Jenny Marie Dr
- 1829 Gayhart Dr
- 1769 Gayhart Dr
- 2540 Jenny Marie Dr
- 2421 Louisiana Dr
- 2540 Cornwall Dr
- 1778 Arapaho Dr
- 2345 Tennessee Dr
- 0 Berkshire Dr Unit 942854
- 910 Wright Ave
- 2257 Maryland Dr
- 2144 Tandem Dr
- 1653 Seneca Dr
- 1272 Bellbrook Ave
- 1618 Navajo Dr
- 2015 Commonwealth Dr
- 2000 Drummond Dr
- 2014 Drummond Dr
- 2027 Commonwealth Dr
- 1965 Commonwealth Dr
- 2000 Commonwealth Dr
- 2070 Wimbledon Dr
- 1986 Commonwealth Dr
- 2028 Drummond Dr
- 2014 Commonwealth Dr
- 1970 Commonwealth Dr
- 2060 Wimbledon Dr
- 2041 Commonwealth Dr
- 2028 Commonwealth Dr
- 2042 Drummond Dr
- 1951 Commonwealth Dr
- 1972 Crase Dr
- 2048 Wimbledon Dr
- 1977 Roxbury Dr
- 1963 Roxbury Dr