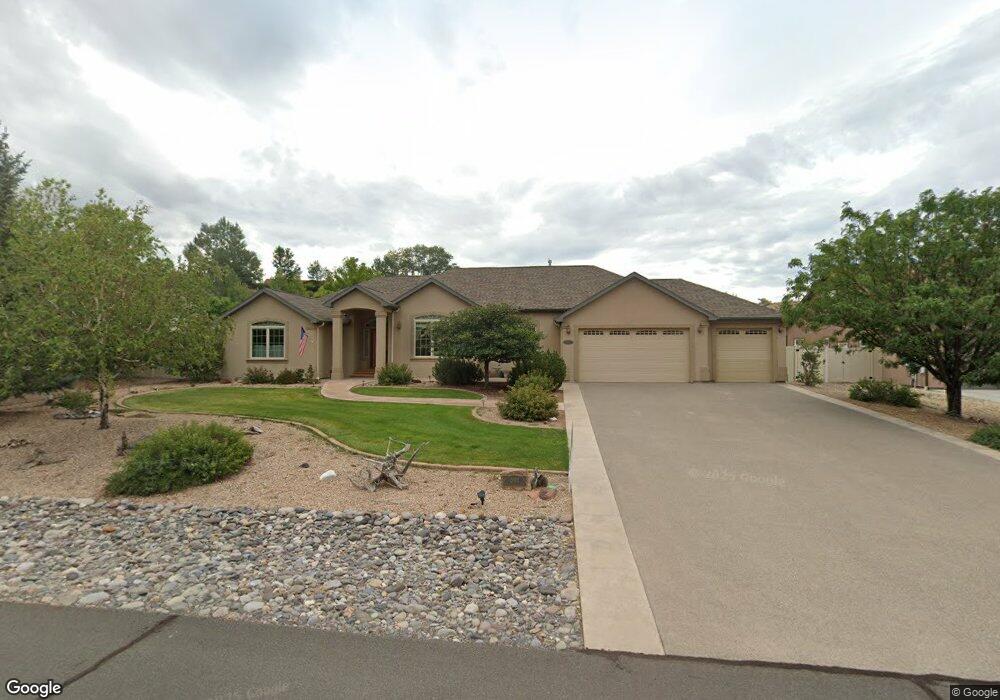
2001 Constitution Loop Unit CASH Montrose, CO 81401
Estimated Value: $713,339 - $754,000
3
Beds
3
Baths
2,275
Sq Ft
$321/Sq Ft
Est. Value
About This Home
This home is located at 2001 Constitution Loop Unit CASH, Montrose, CO 81401 and is currently estimated at $731,085, approximately $321 per square foot. 2001 Constitution Loop Unit CASH is a home located in Montrose County with nearby schools including Johnson Elementary School, Centennial Middle School, and Montrose High School.
Ownership History
Date
Name
Owned For
Owner Type
Purchase Details
Closed on
Nov 18, 2025
Sold by
Hartigan Darrell Patrick
Bought by
Wright Travis and Wright Linda
Current Estimated Value
Home Financials for this Owner
Home Financials are based on the most recent Mortgage that was taken out on this home.
Original Mortgage
$560,000
Outstanding Balance
$560,000
Interest Rate
6.3%
Mortgage Type
New Conventional
Estimated Equity
$171,085
Purchase Details
Closed on
Jun 11, 2019
Sold by
Miller Rodney V
Bought by
Hartigan Darrell P and Hartigan Catherine E
Home Financials for this Owner
Home Financials are based on the most recent Mortgage that was taken out on this home.
Original Mortgage
$336,000
Interest Rate
4.2%
Mortgage Type
New Conventional
Purchase Details
Closed on
Oct 24, 2014
Sold by
Fairbairn Michael L and Fairbairn Karen K
Bought by
Miller Rodney
Purchase Details
Closed on
Jul 31, 2006
Sold by
Milyard Tyler C
Bought by
Fairbairn Michael L and Fairbairn Karen K
Purchase Details
Closed on
Nov 21, 2005
Sold by
Shultz Chad M and Loyd Austin J
Bought by
Milyard Tyler C
Home Financials for this Owner
Home Financials are based on the most recent Mortgage that was taken out on this home.
Original Mortgage
$290,000
Interest Rate
7.5%
Mortgage Type
Adjustable Rate Mortgage/ARM
Create a Home Valuation Report for This Property
The Home Valuation Report is an in-depth analysis detailing your home's value as well as a comparison with similar homes in the area
Home Values in the Area
Average Home Value in this Area
Purchase History
| Date | Buyer | Sale Price | Title Company |
|---|---|---|---|
| Wright Travis | $700,000 | Land Title | |
| Hartigan Darrell P | $420,000 | Land Title Guarantee Co | |
| Miller Rodney | $379,990 | Land Title Guarantee Company | |
| Fairbairn Michael L | $400,000 | None Available | |
| Milyard Tyler C | $345,000 | Security Title |
Source: Public Records
Mortgage History
| Date | Status | Borrower | Loan Amount |
|---|---|---|---|
| Open | Wright Travis | $560,000 | |
| Previous Owner | Hartigan Darrell P | $336,000 | |
| Previous Owner | Milyard Tyler C | $290,000 |
Source: Public Records
Tax History Compared to Growth
Tax History
| Year | Tax Paid | Tax Assessment Tax Assessment Total Assessment is a certain percentage of the fair market value that is determined by local assessors to be the total taxable value of land and additions on the property. | Land | Improvement |
|---|---|---|---|---|
| 2024 | $2,901 | $40,250 | $5,520 | $34,730 |
| 2023 | $2,901 | $45,580 | $6,260 | $39,320 |
| 2022 | $2,138 | $30,630 | $3,480 | $27,150 |
| 2021 | $2,142 | $31,510 | $3,580 | $27,930 |
| 2020 | $1,872 | $27,530 | $3,370 | $24,160 |
| 2019 | $1,884 | $27,530 | $3,370 | $24,160 |
| 2018 | $1,655 | $23,570 | $2,720 | $20,850 |
| 2017 | $1,642 | $23,570 | $2,720 | $20,850 |
| 2016 | $1,621 | $23,650 | $3,010 | $20,640 |
| 2015 | $1,592 | $23,650 | $3,010 | $20,640 |
| 2014 | $1,296 | $20,580 | $3,010 | $17,570 |
Source: Public Records
Map
Nearby Homes
- 1818 Senate St
- 2209 Hatton Place
- 2231 Hill St
- 1817 Freedom Way
- 1624 Election Way
- 1764 Freedom Way
- 3161 Silver Fox Dr
- 1439 Big Pines Dr
- 3308 Congress St
- 3610 Ashberry St
- 3435 Kestrel Loop
- 3218 Meadows Pkwy Unit B
- 3415 Kestrel Loop
- 16168 6794 Ct
- Lot 17 Pinewood St
- Lot 16 Pinewood St
- 3354 Meadows Pkwy
- 3341 Kestrel Loop
- 3004 Silver Fox Dr
- 3315 Pinewood St
- 1949 Constitution Loop
- 2009 Constitution Loop
- 0 Constitution Loop Unit 627750
- 0 Constitution Loop Unit 637709
- 0 Constitution Loop Unit 658703
- 0 Constitution Loop Unit 660261
- 0 Constitution Loop Unit CASH 698016
- 0 Constitution Loop
- 2017 Constitution Loop
- 1941 Constitution Loop
- 2010 Constitution Loop
- 2025 Constitution Loop
- 1934 Constitution Loop
- 2034 Constitution Loop
- 15651 6800 Rd
- 2033 Constitution Loop
- 1918 Constitution Loop
- 1933 Constitution Loop
- 2042 Constitution Loop
- 1925 Constitution Loop