Estimated Value: $909,385
Studio
--
Bath
3,620
Sq Ft
$251/Sq Ft
Est. Value
About This Home
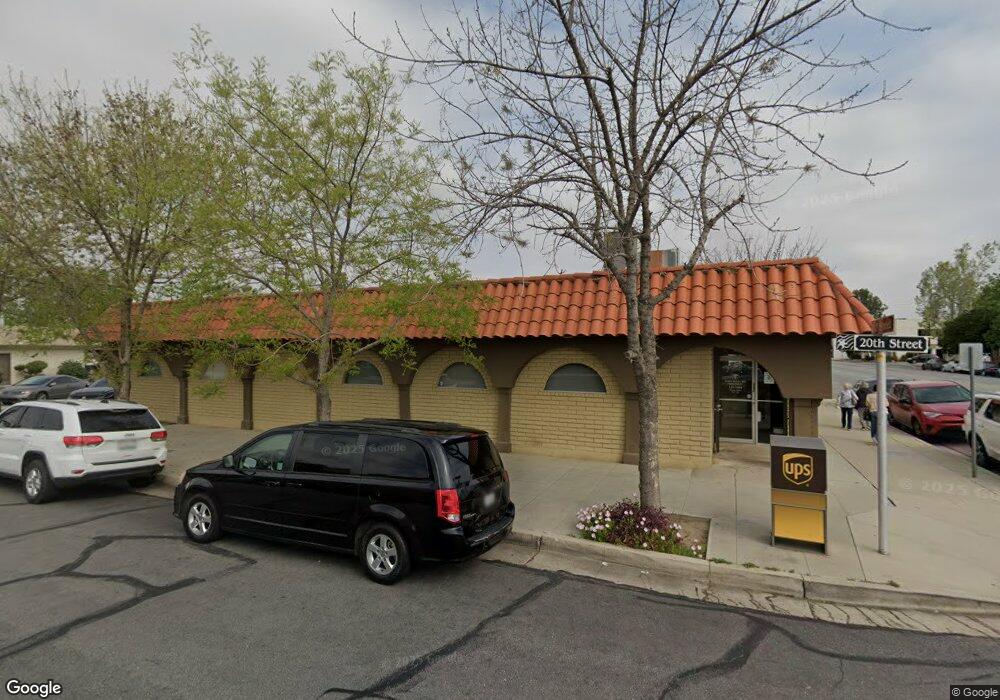
This home is located at 2001 F St, Bakersfield, CA 93301 and is currently estimated at $909,385, approximately $251 per square foot. 2001 F St is a home located in Kern County with nearby schools including Franklin Elementary School, Emerson Middle School, and Bakersfield High School.
Ownership History
Date
Name
Owned For
Owner Type
Purchase Details
Closed on
Dec 15, 2016
Sold by
Consumer Credit Counselors Of Kern Count
Bought by
Sarkies Nadim
Current Estimated Value
Purchase Details
Closed on
Mar 1, 2012
Sold by
Davis Melvin G and Melvin G Davis Trust
Bought by
Consumer Credit Couselors Of Kern County
Home Financials for this Owner
Home Financials are based on the most recent Mortgage that was taken out on this home.
Original Mortgage
$253,000
Interest Rate
3.91%
Mortgage Type
Commercial
Create a Home Valuation Report for This Property
The Home Valuation Report is an in-depth analysis detailing your home's value as well as a comparison with similar homes in the area
Home Values in the Area
Average Home Value in this Area
Purchase History
| Date | Buyer | Sale Price | Title Company |
|---|---|---|---|
| Sarkies Nadim | $500,000 | Chicago Title Company | |
| Consumer Credit Couselors Of Kern County | $460,000 | Ticor Title Company Of Ca |
Source: Public Records
Mortgage History
| Date | Status | Borrower | Loan Amount |
|---|---|---|---|
| Previous Owner | Consumer Credit Couselors Of Kern County | $253,000 |
Source: Public Records
Tax History
| Year | Tax Paid | Tax Assessment Tax Assessment Total Assessment is a certain percentage of the fair market value that is determined by local assessors to be the total taxable value of land and additions on the property. | Land | Improvement |
|---|---|---|---|---|
| 2025 | $6,936 | $580,287 | $226,311 | $353,976 |
| 2024 | $6,813 | $568,910 | $221,874 | $347,036 |
| 2023 | $6,813 | $557,756 | $217,524 | $340,232 |
| 2022 | $6,712 | $546,820 | $213,259 | $333,561 |
| 2021 | $6,639 | $536,099 | $209,078 | $327,021 |
| 2020 | $6,627 | $530,603 | $206,935 | $323,668 |
| 2019 | $6,498 | $530,603 | $206,935 | $323,668 |
| 2018 | $6,339 | $510,000 | $198,900 | $311,100 |
| 2017 | $6,319 | $500,000 | $195,000 | $305,000 |
| 2016 | $217 | $488,075 | $138,994 | $349,081 |
| 2015 | $212 | $480,745 | $136,907 | $343,838 |
| 2014 | $207 | $471,329 | $134,226 | $337,103 |
Source: Public Records
Map
Nearby Homes
Your Personal Tour Guide
Ask me questions while you tour the home.