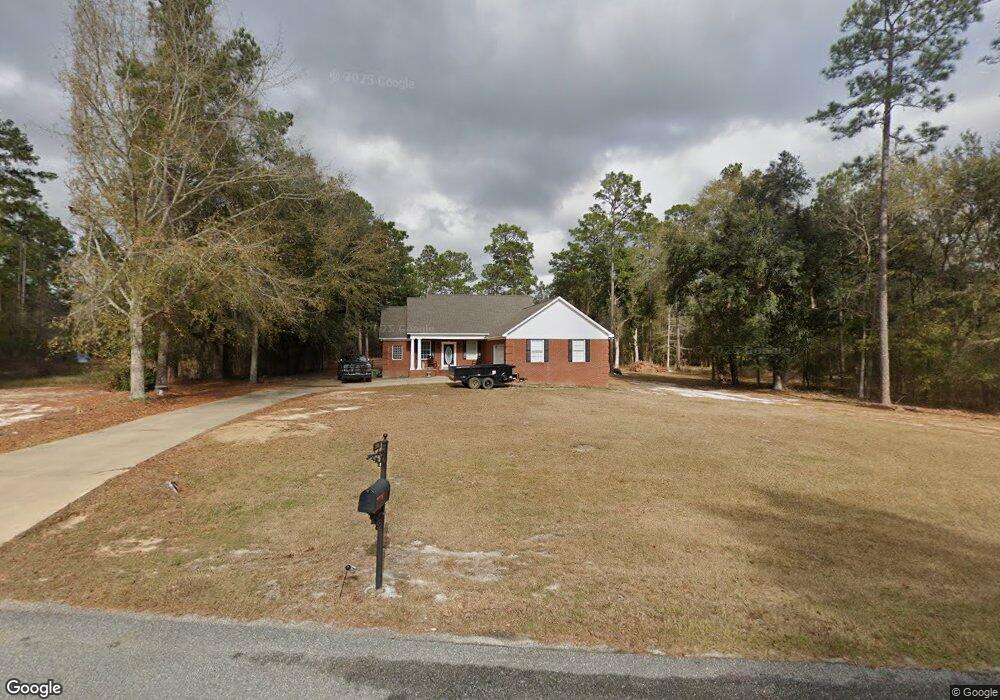
2001 Huntington Dr Bainbridge, GA 39819
Estimated Value: $308,424 - $373,000
--
Bed
1
Bath
1,872
Sq Ft
$184/Sq Ft
Est. Value
About This Home
This home is located at 2001 Huntington Dr, Bainbridge, GA 39819 and is currently estimated at $344,856, approximately $184 per square foot. 2001 Huntington Dr is a home located in Decatur County with nearby schools including Bainbridge High School and Grace Christian Academy.
Ownership History
Date
Name
Owned For
Owner Type
Purchase Details
Closed on
May 22, 2008
Sold by
Rentz Stevekn Gregory
Bought by
Rentz Karen D
Current Estimated Value
Purchase Details
Closed on
Apr 20, 2006
Sold by
Rentz Gregory S
Bought by
Dollar J Clifford
Purchase Details
Closed on
Mar 18, 2005
Sold by
Dehildren Properties Inc
Bought by
Rentz Gregory S and Rentz Karen D
Purchase Details
Closed on
Jan 8, 2005
Sold by
Sands Construction Inc
Bought by
Dehildren Properties Inc
Create a Home Valuation Report for This Property
The Home Valuation Report is an in-depth analysis detailing your home's value as well as a comparison with similar homes in the area
Home Values in the Area
Average Home Value in this Area
Purchase History
| Date | Buyer | Sale Price | Title Company |
|---|---|---|---|
| Rentz Karen D | -- | -- | |
| Dollar J Clifford | -- | -- | |
| Rentz Gregory S | $174,500 | -- | |
| Dehildren Properties Inc | -- | -- |
Source: Public Records
Mortgage History
| Date | Status | Borrower | Loan Amount |
|---|---|---|---|
| Closed | Rentz Gregory S | $0 |
Source: Public Records
Tax History Compared to Growth
Tax History
| Year | Tax Paid | Tax Assessment Tax Assessment Total Assessment is a certain percentage of the fair market value that is determined by local assessors to be the total taxable value of land and additions on the property. | Land | Improvement |
|---|---|---|---|---|
| 2024 | $3,361 | $108,090 | $10,000 | $98,090 |
| 2023 | $2,864 | $108,090 | $10,000 | $98,090 |
| 2022 | $3,174 | $104,670 | $10,000 | $94,670 |
| 2021 | $3,010 | $96,833 | $10,000 | $86,833 |
| 2020 | $2,756 | $84,161 | $10,000 | $74,161 |
| 2019 | $2,724 | $80,165 | $10,000 | $70,165 |
| 2018 | $2,613 | $77,830 | $10,000 | $67,830 |
| 2017 | $2,721 | $77,830 | $10,000 | $67,830 |
| 2016 | $2,661 | $77,830 | $10,000 | $67,830 |
| 2015 | $2,738 | $77,830 | $10,000 | $67,830 |
| 2014 | $2,538 | $77,830 | $10,000 | $67,830 |
| 2013 | -- | $73,760 | $10,000 | $63,760 |
Source: Public Records
Map
Nearby Homes
- 1417 College Rd
- 0 Knollwood Cir Unit 10601153
- 0 Meadow Ridge Dr
- 2010 Ashton Way
- 2107 Hughes St
- 2219 Wyndham Way
- 186 Turtle Pond Rd
- 2451 Lake Douglas Rd
- 1901 Douglas Dr
- 1715 Douglas Dr
- 1600 Dogwood Dr
- 1512 Douglas Dr
- 1606 Twin Lakes Dr
- 1602 Twin Lakes Dr
- 1604 Twin Lakes Dr
- 1504 Woodland Dr
- 1511 Woodland Dr
- 1702 Culbreth St
- 1402 Pineland Dr
- 1907 Gragg St
- 1409 College Rd
- 1014 Carters Ct
- 2005 Huntington Dr
- 1407 College Rd
- 1004 Kyles Way
- 1412 Bridgeton Ln
- 1003 Carters Ct
- 1010 Carters Ct
- 2004 Huntington Dr
- 1405 College Rd
- 1006 Kyles Way
- 1419 College Rd
- 1410 Bridgeton Ln
- 1008 Carters Ct
- Lot 3 Kyles Way
- 1003 Kyles Way
- 1005 Kyles Way
- 0 Kyles Way
- 2059 Ashton Way
- 1410 College Rd