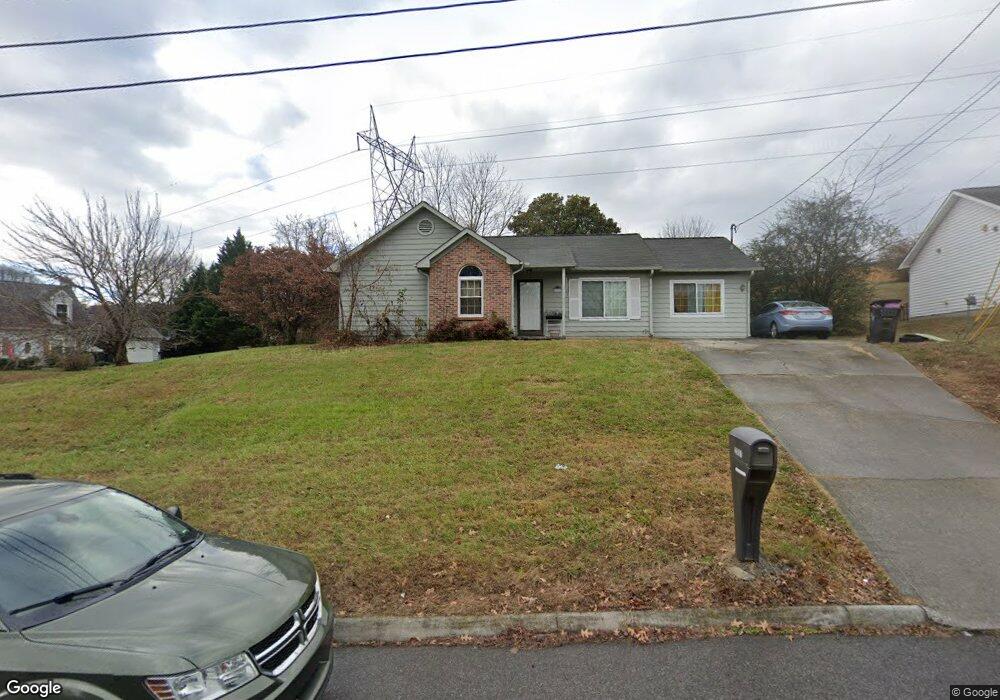
2001 Hyde Park Ln Knoxville, TN 37921
West Knoxville NeighborhoodEstimated Value: $322,819 - $333,000
4
Beds
2
Baths
1,369
Sq Ft
$239/Sq Ft
Est. Value
About This Home
This home is located at 2001 Hyde Park Ln, Knoxville, TN 37921 and is currently estimated at $327,705, approximately $239 per square foot. 2001 Hyde Park Ln is a home located in Knox County with nearby schools including Amherst Elementary School, Northwest Middle School, and Karns High School.
Ownership History
Date
Name
Owned For
Owner Type
Purchase Details
Closed on
Jan 26, 2015
Sold by
Asante Tameka Tift and Tift Tameka M
Bought by
Asante Tameka Tift and Asante Kevin Oteng
Current Estimated Value
Purchase Details
Closed on
Feb 14, 2013
Sold by
Tift Jennifer
Bought by
Tift Tameka M
Purchase Details
Closed on
Jul 5, 2005
Sold by
Caldwell Patrick D and Caldwell Johanna J
Bought by
Tift Tameka M and Tift Jennifer
Home Financials for this Owner
Home Financials are based on the most recent Mortgage that was taken out on this home.
Original Mortgage
$106,000
Interest Rate
7.86%
Mortgage Type
Stand Alone First
Purchase Details
Closed on
Apr 30, 1999
Sold by
Dixon Cheryl E and Parks Ii James
Bought by
Caldwell Patrick D and Caldwell Johanna J
Home Financials for this Owner
Home Financials are based on the most recent Mortgage that was taken out on this home.
Original Mortgage
$58,800
Interest Rate
7.06%
Mortgage Type
Purchase Money Mortgage
Create a Home Valuation Report for This Property
The Home Valuation Report is an in-depth analysis detailing your home's value as well as a comparison with similar homes in the area
Home Values in the Area
Average Home Value in this Area
Purchase History
| Date | Buyer | Sale Price | Title Company |
|---|---|---|---|
| Asante Tameka Tift | -- | None Available | |
| Tift Tameka M | -- | None Available | |
| Tift Tameka M | $106,000 | Sterling Titles Inc | |
| Caldwell Patrick D | $73,500 | Knox Title |
Source: Public Records
Mortgage History
| Date | Status | Borrower | Loan Amount |
|---|---|---|---|
| Previous Owner | Tift Tameka M | $106,000 | |
| Previous Owner | Caldwell Patrick D | $58,800 |
Source: Public Records
Tax History Compared to Growth
Tax History
| Year | Tax Paid | Tax Assessment Tax Assessment Total Assessment is a certain percentage of the fair market value that is determined by local assessors to be the total taxable value of land and additions on the property. | Land | Improvement |
|---|---|---|---|---|
| 2024 | $1,907 | $51,400 | $0 | $0 |
| 2023 | $1,907 | $51,400 | $0 | $0 |
| 2022 | $1,907 | $51,400 | $0 | $0 |
| 2021 | $1,626 | $35,475 | $0 | $0 |
| 2020 | $1,626 | $35,475 | $0 | $0 |
| 2019 | $1,626 | $35,475 | $0 | $0 |
| 2018 | $1,626 | $35,475 | $0 | $0 |
| 2017 | $1,626 | $35,475 | $0 | $0 |
| 2016 | $1,466 | $0 | $0 | $0 |
| 2015 | $1,466 | $0 | $0 | $0 |
| 2014 | $1,466 | $0 | $0 | $0 |
Source: Public Records
Map
Nearby Homes
- 4316 McKamey Rd
- 1950 Everhart Ln
- 5320 Cain Rd
- 5335 Amherst Woods Ln
- 5020 Sunshine Ln
- 6409 Shrewsbury Dr NW
- 5360 Amherst Woods Ln
- 1972 Jackson Rd
- 2444 Brierbrook Ln
- 2308 Woods Smith Rd
- 5400 Summitridge Ln
- 6513 Trousdale Rd
- 5405 Crooked Pine Ln
- 5910 Autumn Oaks Ln
- 6400 Mill Creek Ln Unit 3
- 6416 Trousdale Rd
- 2109 Larimer St
- 5812 Wexford Ln
- 6905 Ellesmere Dr
- 6721 Ellesmere Dr NW
- 2000 Hyde Park Ln
- 2005 Hyde Park Ln
- 4733 Brierley Dr
- 4729 Brierley Dr
- 4725 Brierley Dr
- 4721 Brierley Dr
- 2004 Hyde Park Ln
- 2009 Hyde Park Ln
- 4712 Brierley Dr
- 4737 Brierley Dr
- 4717 Brierley Dr
- 4724 Brierley Dr
- 2013 Hyde Park Ln
- 2008 Hyde Park Ln
- 4708 Brierley Dr
- 4741 Brierley Dr
- 2017 Hyde Park Ln
- 2012 Hyde Park Ln
- 4728 Brierley Dr Unit 3
- 4600 Woodbridge Ln