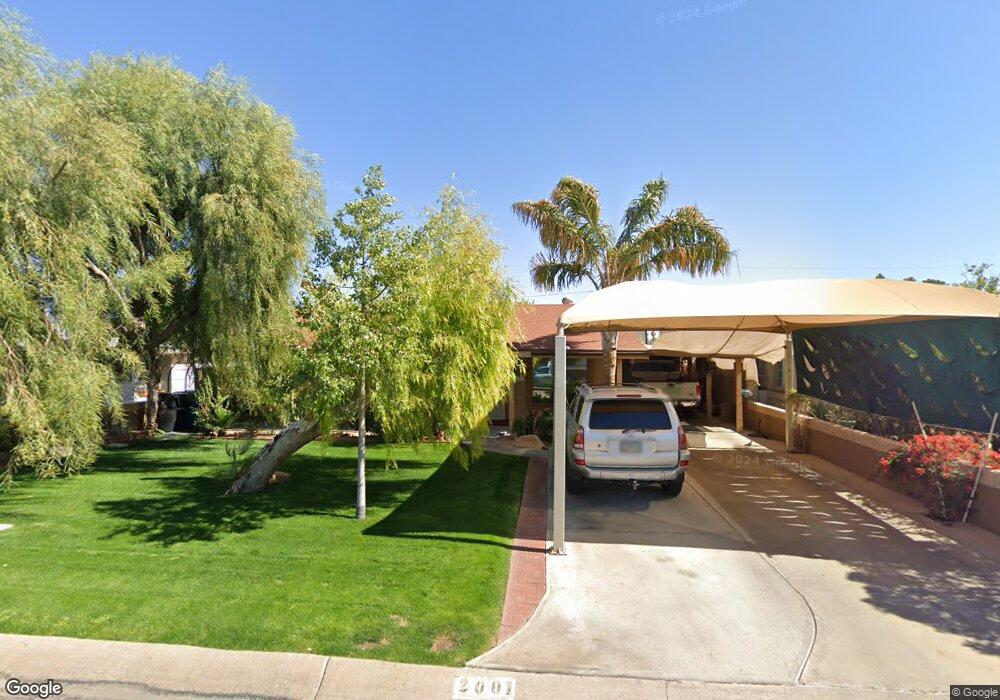
2001 N 28th St Phoenix, AZ 85008
Central City NeighborhoodEstimated Value: $289,000 - $516,000
Studio
1
Bath
1,566
Sq Ft
$245/Sq Ft
Est. Value
About This Home
This home is located at 2001 N 28th St, Phoenix, AZ 85008 and is currently estimated at $384,397, approximately $245 per square foot. 2001 N 28th St is a home located in Maricopa County with nearby schools including The Creighton Academy, Camelback High School, and Phoenix Coding Academy.
Ownership History
Date
Name
Owned For
Owner Type
Purchase Details
Closed on
Aug 11, 2003
Sold by
Figueroa David
Bought by
Hernandez Adolfo Figueroa and Figueroa Adolfo
Current Estimated Value
Home Financials for this Owner
Home Financials are based on the most recent Mortgage that was taken out on this home.
Original Mortgage
$89,600
Outstanding Balance
$38,507
Interest Rate
5.29%
Mortgage Type
Purchase Money Mortgage
Estimated Equity
$345,890
Purchase Details
Closed on
Aug 26, 1998
Sold by
Barento Jared Mussa and Abdalla Sofia S
Bought by
Figueroa David and Figueroa Adolfo
Home Financials for this Owner
Home Financials are based on the most recent Mortgage that was taken out on this home.
Original Mortgage
$64,775
Interest Rate
6.91%
Mortgage Type
FHA
Create a Home Valuation Report for This Property
The Home Valuation Report is an in-depth analysis detailing your home's value as well as a comparison with similar homes in the area
Home Values in the Area
Average Home Value in this Area
Purchase History
| Date | Buyer | Sale Price | Title Company |
|---|---|---|---|
| Hernandez Adolfo Figueroa | -- | Security Title Agency | |
| Figueroa David | $65,000 | Chicago Title Insurance Co |
Source: Public Records
Mortgage History
| Date | Status | Borrower | Loan Amount |
|---|---|---|---|
| Open | Hernandez Adolfo Figueroa | $89,600 | |
| Closed | Figueroa David | $64,775 |
Source: Public Records
Tax History
| Year | Tax Paid | Tax Assessment Tax Assessment Total Assessment is a certain percentage of the fair market value that is determined by local assessors to be the total taxable value of land and additions on the property. | Land | Improvement |
|---|---|---|---|---|
| 2025 | $1,375 | $11,509 | -- | -- |
| 2024 | $1,306 | $10,961 | -- | -- |
| 2023 | $1,306 | $27,380 | $5,470 | $21,910 |
| 2022 | $1,251 | $20,860 | $4,170 | $16,690 |
| 2021 | $1,298 | $20,010 | $4,000 | $16,010 |
| 2020 | $1,264 | $16,980 | $3,390 | $13,590 |
| 2019 | $1,257 | $13,470 | $2,690 | $10,780 |
| 2018 | $1,229 | $11,780 | $2,350 | $9,430 |
| 2017 | $1,179 | $10,250 | $2,050 | $8,200 |
| 2016 | $516 | $5,300 | $1,060 | $4,240 |
| 2015 | $481 | $4,050 | $810 | $3,240 |
Source: Public Records
Map
Nearby Homes
- 2046 N 27th Place
- 2031 N 28th Place
- 2021 N 29th St
- 2231 N 28th St
- 2230 N 27th Place
- 2202 N 26th Place
- 2101 N 25th Place
- 1816 N 25th Place
- 2245 N 28th St
- 2950 E Granada Rd
- 2126 N 25th Place
- 2201 N 29th Place
- 2621 E Brill St
- 2646 E Willetta St
- 1915 N 31st St
- 2112 N 24th Place
- 2512 N 29th St
- 2214 N 24th Place
- 2419 E Oak St
- 1713 N 31st Place
- 2005 N 28th St
- 1845 N 28th St
- 1839 N 28th St
- 2011 N 28th St
- 2002 N 28th St
- 1835 N 28th St
- 2006 N 28th St
- 1846 N 28th St
- 2015 N 28th St
- 1840 N 28th St
- 2012 N 28th St
- 1829 N 28th St
- 1836 N 28th St
- 2019 N 28th St
- 1830 N 28th St
- 1825 N 28th St
- 2025 N 28th St
- 2001 N 27th Place
- 2005 N 27th Place
- 1845 N 27th Place
Your Personal Tour Guide
Ask me questions while you tour the home.