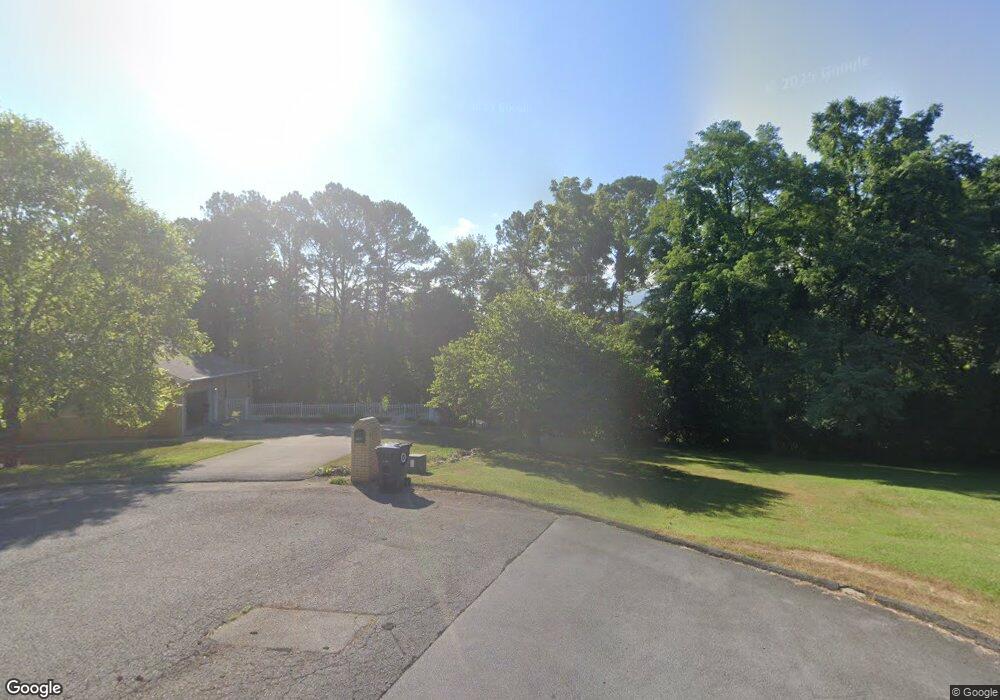
2001 Vantage View Dr Morristown, TN 37814
Estimated Value: $621,000 - $765,363
--
Bed
4
Baths
5,572
Sq Ft
$124/Sq Ft
Est. Value
About This Home
This home is located at 2001 Vantage View Dr, Morristown, TN 37814 and is currently estimated at $693,182, approximately $124 per square foot. 2001 Vantage View Dr is a home located in Hamblen County with nearby schools including West Elementary School, Lincoln Heights Middle School, and Morristown West High School.
Ownership History
Date
Name
Owned For
Owner Type
Purchase Details
Closed on
May 13, 2025
Sold by
Nichols Ann C
Bought by
Nichols Article 9 Family Trust and Nichols
Current Estimated Value
Purchase Details
Closed on
Feb 25, 2016
Sold by
Nichols Joseph O
Bought by
Nichols Ann C
Purchase Details
Closed on
Nov 21, 2014
Sold by
Nichols Pamela
Bought by
Nichols Ann C
Purchase Details
Closed on
Dec 21, 2010
Sold by
Snowden Clyde Eugene
Bought by
Nichols Ann C
Purchase Details
Closed on
Jun 27, 2005
Bought by
Nichols Ann C
Purchase Details
Closed on
May 13, 1994
Bought by
Nichols Harold and Nichols Ann
Purchase Details
Closed on
Jan 20, 1989
Bought by
Nichols Harold and Nichols Ann
Purchase Details
Closed on
Dec 13, 1983
Bought by
Nichols Harold and Nichols Ann
Purchase Details
Closed on
Oct 27, 1972
Bought by
Snowden Clyde E and Snowden Linda
Create a Home Valuation Report for This Property
The Home Valuation Report is an in-depth analysis detailing your home's value as well as a comparison with similar homes in the area
Home Values in the Area
Average Home Value in this Area
Purchase History
| Date | Buyer | Sale Price | Title Company |
|---|---|---|---|
| Nichols Article 9 Family Trust | -- | None Listed On Document | |
| Nichols Article 9 Family Trust | -- | None Listed On Document | |
| Nichols Ann C | -- | -- | |
| Nichols Ann C | $50,000 | -- | |
| Nichols Ann C | -- | -- | |
| Nichols Ann C | -- | -- | |
| Nichols Harold | $5,400 | -- | |
| Nichols Harold | -- | -- | |
| Nichols Harold | -- | -- | |
| Snowden Clyde E | -- | -- |
Source: Public Records
Tax History Compared to Growth
Tax History
| Year | Tax Paid | Tax Assessment Tax Assessment Total Assessment is a certain percentage of the fair market value that is determined by local assessors to be the total taxable value of land and additions on the property. | Land | Improvement |
|---|---|---|---|---|
| 2024 | $1,903 | $108,150 | $15,000 | $93,150 |
| 2023 | $1,903 | $108,150 | $0 | $0 |
| 2022 | $3,417 | $108,150 | $15,000 | $93,150 |
| 2021 | $3,417 | $108,150 | $15,000 | $93,150 |
| 2020 | $3,413 | $108,150 | $15,000 | $93,150 |
| 2019 | $3,336 | $98,100 | $14,250 | $83,850 |
| 2018 | $3,090 | $98,100 | $14,250 | $83,850 |
| 2017 | $3,041 | $98,100 | $14,250 | $83,850 |
| 2016 | $2,904 | $98,100 | $14,250 | $83,850 |
| 2015 | $2,702 | $98,100 | $14,250 | $83,850 |
| 2014 | -- | $98,100 | $14,250 | $83,850 |
| 2013 | -- | $111,250 | $0 | $0 |
Source: Public Records
Map
Nearby Homes
- 1361 Appalachian Trace
- 1225 Appalachian Trace
- 509 Windridge Ln
- Lot 267 Waterview Way
- Lot 295 Inlet Cove
- 1171 Pine Haven Dr
- 1770 Walters Dr
- 877 Pine Haven Dr
- 1230 Mcfarland St Unit 37
- 1230 Mcfarland St Unit 3
- 1318 Secretariat Dr
- 1626 Cardinal Dr
- 506 Katerina Dr
- 1613 Cardinal Dr
- 145 Virginia Ave
- 137 Morton St
- 2332 Sydney Ct Unit 1
- 2332 Sydney Ct
- 235 Gilbert St
- 302 Kensington Dr
- 1188 W Wildwood Dr
- 2003 Vantage View Dr
- 1256 Appalachian Trace
- 1242 Appalachian Trace
- 1204 W Wildwood Dr
- 1296 Appalachian Trace
- 1236 Appalachian Trace
- 1340 Appalachian Trace
- 2101 Vantage View Dr
- 1203 W Wildwood Dr
- 2105 Vantage View Dr
- 1344 Appalachian Trace
- 1230 Appalachian Trace
- 2109 Vantage View Dr
- 1212 W Wildwood Dr
- 1362 Appalachian Trace
- 1237 Appalachian Trace
- 1215 W Wildwood Dr
- 1255 Appalachian Trace
- 1226 Appalachian Trace