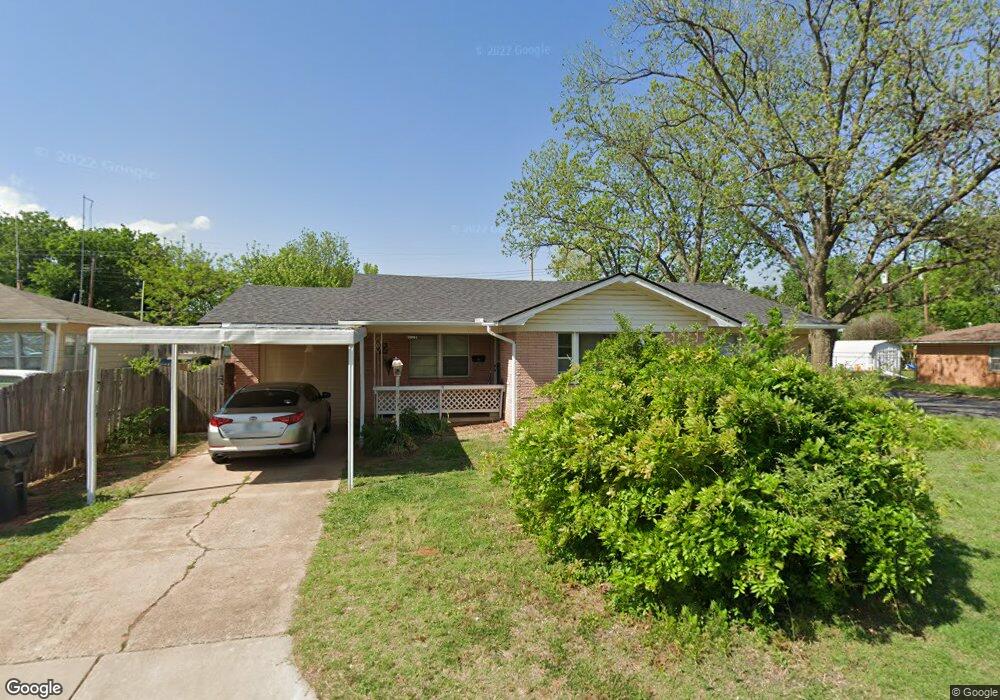
2001 W Walnut Ave Duncan, OK 73533
Estimated Value: $114,000 - $172,000
3
Beds
3
Baths
2,017
Sq Ft
$70/Sq Ft
Est. Value
About This Home
This home is located at 2001 W Walnut Ave, Duncan, OK 73533 and is currently estimated at $140,933, approximately $69 per square foot. 2001 W Walnut Ave is a home located in Stephens County with nearby schools including Mark Twain Elementary School, Duncan Middle School, and Duncan High School.
Ownership History
Date
Name
Owned For
Owner Type
Purchase Details
Closed on
Jul 25, 2013
Sold by
Armstrong Pamela A and Armstrong Paul
Bought by
Epp Maria
Current Estimated Value
Home Financials for this Owner
Home Financials are based on the most recent Mortgage that was taken out on this home.
Original Mortgage
$54,000
Interest Rate
3.99%
Mortgage Type
Purchase Money Mortgage
Purchase Details
Closed on
Mar 19, 2010
Sold by
Gilmore Carole Ann and Gilmore Carole
Bought by
Armstrong Pamela A
Home Financials for this Owner
Home Financials are based on the most recent Mortgage that was taken out on this home.
Original Mortgage
$52,000
Interest Rate
4.93%
Mortgage Type
Purchase Money Mortgage
Purchase Details
Closed on
Sep 9, 1992
Sold by
Toellner Robert L
Create a Home Valuation Report for This Property
The Home Valuation Report is an in-depth analysis detailing your home's value as well as a comparison with similar homes in the area
Purchase History
| Date | Buyer | Sale Price | Title Company |
|---|---|---|---|
| Epp Maria | $60,000 | None Available | |
| Armstrong Pamela A | $58,500 | None Available | |
| -- | $28,500 | -- |
Source: Public Records
Mortgage History
| Date | Status | Borrower | Loan Amount |
|---|---|---|---|
| Closed | Epp Maria | $54,000 | |
| Previous Owner | Armstrong Pamela A | $52,000 |
Source: Public Records
Tax History
| Year | Tax Paid | Tax Assessment Tax Assessment Total Assessment is a certain percentage of the fair market value that is determined by local assessors to be the total taxable value of land and additions on the property. | Land | Improvement |
|---|---|---|---|---|
| 2025 | $696 | $8,255 | $612 | $7,643 |
| 2024 | $672 | $7,890 | $612 | $7,278 |
| 2023 | $672 | $7,890 | $612 | $7,278 |
| 2022 | $608 | $7,157 | $612 | $6,545 |
| 2021 | $519 | $6,100 | $612 | $5,488 |
| 2020 | $489 | $5,667 | $612 | $5,055 |
| 2019 | $467 | $5,397 | $612 | $4,785 |
| 2018 | $458 | $5,397 | $612 | $4,785 |
| 2017 | $421 | $4,896 | $612 | $4,284 |
| 2016 | $542 | $6,371 | $612 | $5,759 |
| 2015 | $591 | $6,371 | $612 | $5,759 |
| 2014 | $591 | $6,734 | $550 | $6,184 |
Source: Public Records
Map
Nearby Homes
- 2006 W Oak Ave
- 174831 N 2844 Rd
- 2150 W Main St
- 2110 W Main St
- 1905 W Ash Ave
- 209 N 22nd St
- 1705 W Ash Ave
- 123 N Highway 81
- 27 N 14th St
- 2210 Western Dr
- 2002 Redbud Ave
- 208 N 29th St
- 1314 W Beech Ave
- 1309 W Beech Ave
- 261 N 29th St
- 1203 W Walnut Ave
- 0 W Beech Ave
- 305 S 12th St
- 2206 W Spruce Ave
- 1106 W Ash Ave
- 2003 W Walnut Ave
- 1911 W Walnut Ave
- 2002 W Birch Ave
- 2005 W Walnut Ave
- 2004 W Birch Ave
- 2002 W Walnut Ave
- 1912 W Birch Ave
- 2004 W Walnut Ave
- 2006 W Birch Ave
- 1912 W Birch Ave
- 1909 W Walnut Ave
- 1912 W Walnut Ave
- 2006 W Walnut Ave
- 2007 W Walnut Ave
- 1910 W Birch Ave
- 2008 W Birch Ave
- 1910 W Walnut Ave
- 1907 W Walnut Ave
- 2008 W Walnut Ave
- 2009 W Walnut Ave
Your Personal Tour Guide
Ask me questions while you tour the home.