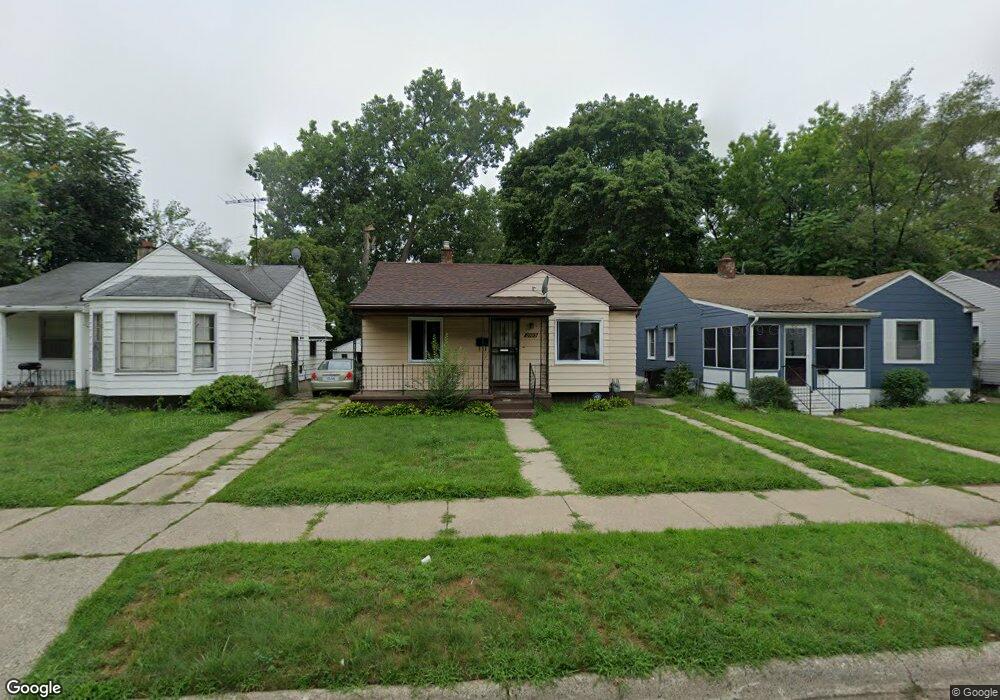
20019 Fenmore St Detroit, MI 48235
Greenfield NeighborhoodEstimated Value: $65,000 - $84,315
2
Beds
1
Bath
948
Sq Ft
$80/Sq Ft
Est. Value
About This Home
This home is located at 20019 Fenmore St, Detroit, MI 48235 and is currently estimated at $76,079, approximately $80 per square foot. 20019 Fenmore St is a home located in Wayne County with nearby schools including Bow Elementary-Middle School, Charles L. Spain Elementary-Middle School, and Edward 'Duke' Ellington Conservatory of Music and Art.
Ownership History
Date
Name
Owned For
Owner Type
Purchase Details
Closed on
Oct 2, 2018
Sold by
Robinson Alfred L
Bought by
Capers Michael
Current Estimated Value
Purchase Details
Closed on
Dec 21, 2011
Sold by
Goldsmith Terrace
Bought by
A L R Investments
Purchase Details
Closed on
Oct 7, 2011
Sold by
Robinson Alfred and Robinson Anna C
Bought by
Goldsmith Terrace
Purchase Details
Closed on
Dec 10, 2001
Sold by
Jame Llc
Bought by
Alr Investments
Create a Home Valuation Report for This Property
The Home Valuation Report is an in-depth analysis detailing your home's value as well as a comparison with similar homes in the area
Home Values in the Area
Average Home Value in this Area
Purchase History
| Date | Buyer | Sale Price | Title Company |
|---|---|---|---|
| Capers Michael | $3,000 | None Available | |
| A L R Investments | -- | None Available | |
| Goldsmith Terrace | $7,100 | Progressive Title | |
| Alr Investments | $29,903 | -- |
Source: Public Records
Tax History Compared to Growth
Tax History
| Year | Tax Paid | Tax Assessment Tax Assessment Total Assessment is a certain percentage of the fair market value that is determined by local assessors to be the total taxable value of land and additions on the property. | Land | Improvement |
|---|---|---|---|---|
| 2025 | $1,054 | $38,200 | $0 | $0 |
| 2024 | $1,054 | $34,300 | $0 | $0 |
| 2023 | $1,023 | $27,200 | $0 | $0 |
| 2022 | $1,086 | $20,900 | $0 | $0 |
| 2021 | $1,058 | $16,600 | $0 | $0 |
| 2020 | $1,058 | $15,300 | $0 | $0 |
| 2019 | $1,043 | $12,500 | $0 | $0 |
| 2018 | $922 | $10,300 | $0 | $0 |
| 2017 | $165 | $9,600 | $0 | $0 |
| 2016 | $1,005 | $10,100 | $0 | $0 |
| 2015 | $1,010 | $10,100 | $0 | $0 |
| 2013 | $1,423 | $14,231 | $0 | $0 |
| 2010 | -- | $20,390 | $856 | $19,534 |
Source: Public Records
Map
Nearby Homes
- 20014 Southfield Rd
- 20004 Southfield Fwy
- 20052 Archdale St
- 19925 Archdale St
- 20220 Ashton Ave
- 20051 Oakfield St
- 20201 Ashton Ave
- 20210 Archdale St
- 20245 Archdale St
- 19950 Oakfield St
- 18231 Pembroke Ave
- 19765 Archdale St
- 20510 Fenmore St
- 19781 Oakfield St
- 19731 Harlow St
- 19940 Faust Ave
- 20200 Lindsay St
- 19751 Oakfield St
- 19786 Oakfield St
- 19780 Oakfield St
- 20011 Fenmore St
- 20027 Fenmore St
- 20003 Fenmore St
- 20035 Fenmore St
- 20043 Fenmore St
- 20014 Southfield Fwy
- 20022 Southfield Fwy
- 20030 Southfield Fwy
- 20038 Southfield Fwy
- 20051 Fenmore St
- 20046 Southfield Fwy
- 19973 Fenmore St
- 20018 Fenmore St
- 20010 Fenmore St
- 20026 Fenmore St
- 20061 Fenmore St
- 20000 Fenmore St
- 20034 Fenmore St
- 20056 Southfield Fwy
- 20042 Fenmore St