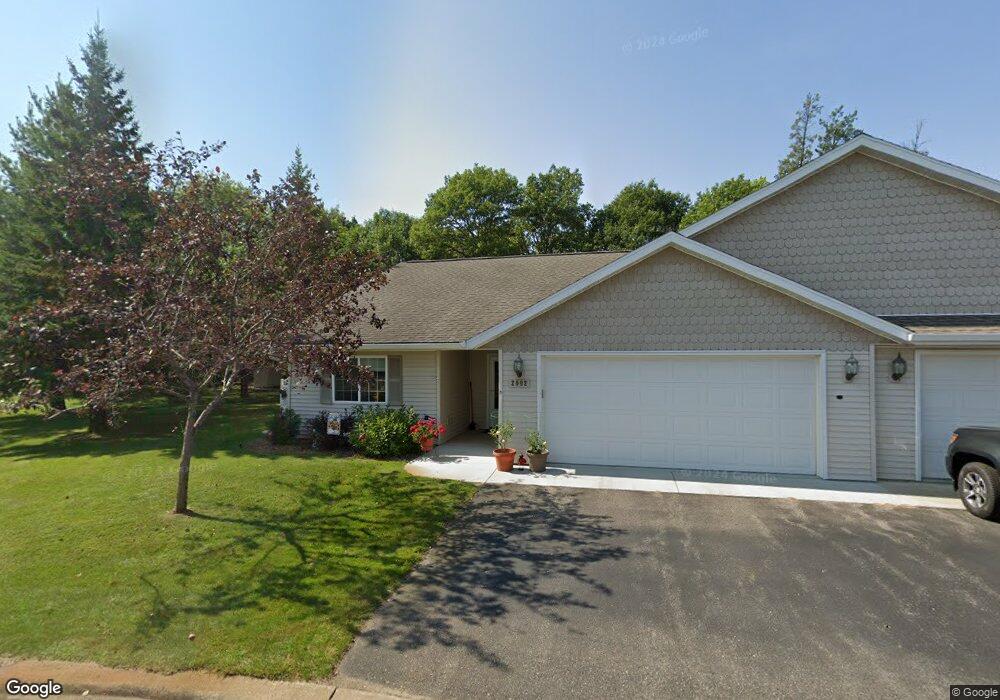
2002 Deep Rock Loop SW Bemidji, MN 56601
Estimated Value: $270,669 - $286,000
3
Beds
1
Bath
1,357
Sq Ft
$203/Sq Ft
Est. Value
About This Home
This home is located at 2002 Deep Rock Loop SW, Bemidji, MN 56601 and is currently estimated at $275,667, approximately $203 per square foot. 2002 Deep Rock Loop SW is a home located in Beltrami County with nearby schools including Horace May Elementary School, Bemidji Middle School, and Bemidji Senior High School.
Ownership History
Date
Name
Owned For
Owner Type
Purchase Details
Closed on
Sep 20, 2021
Sold by
Brouse Michael S and A C Brouse Family Trust
Bought by
Dufault Kathleen M and Dufault Michael J
Current Estimated Value
Home Financials for this Owner
Home Financials are based on the most recent Mortgage that was taken out on this home.
Original Mortgage
$233,500
Outstanding Balance
$45,288
Interest Rate
2.8%
Mortgage Type
New Conventional
Estimated Equity
$230,379
Purchase Details
Closed on
Jan 22, 2009
Sold by
Roth Mari W
Bought by
Brouse Michael S and Berglund Cathy A
Purchase Details
Closed on
Jan 8, 2008
Sold by
Roth Delbert N and Roth Mari W
Bought by
Roth Delbert N and Roth Mari W
Purchase Details
Closed on
Oct 31, 2006
Sold by
B T L Const Inc
Bought by
Mari W Roth Revocable Trust
Create a Home Valuation Report for This Property
The Home Valuation Report is an in-depth analysis detailing your home's value as well as a comparison with similar homes in the area
Home Values in the Area
Average Home Value in this Area
Purchase History
| Date | Buyer | Sale Price | Title Company |
|---|---|---|---|
| Dufault Kathleen M | $229,000 | None Available | |
| Brouse Michael S | -- | None Available | |
| Roth Delbert N | -- | None Available | |
| Mari W Roth Revocable Trust | $160,393 | None Available | |
| Dufault Mary Mary | $229,000 | -- |
Source: Public Records
Mortgage History
| Date | Status | Borrower | Loan Amount |
|---|---|---|---|
| Open | Dufault Kathleen M | $233,500 | |
| Closed | Dufault Mary Mary | $229,000 |
Source: Public Records
Tax History
| Year | Tax Paid | Tax Assessment Tax Assessment Total Assessment is a certain percentage of the fair market value that is determined by local assessors to be the total taxable value of land and additions on the property. | Land | Improvement |
|---|---|---|---|---|
| 2025 | $3,080 | $267,100 | $29,100 | $238,000 |
| 2024 | $3,072 | $257,400 | $29,100 | $228,300 |
| 2023 | $2,812 | $257,400 | $29,100 | $228,300 |
| 2022 | $2,664 | $229,400 | $29,100 | $200,300 |
| 2021 | $2,516 | $180,500 | $25,500 | $155,000 |
| 2019 | $2,502 | $180,500 | $25,500 | $155,000 |
| 2018 | $2,504 | $177,700 | $25,500 | $152,200 |
| 2016 | $2,274 | $169,900 | $25,500 | $144,400 |
| 2015 | $2,008 | $164,700 | $0 | $0 |
| 2014 | $1,846 | $153,100 | $0 | $0 |
| 2011 | $1,740 | $139,900 | $0 | $0 |
Source: Public Records
Map
Nearby Homes
- 2224 Deep Rock Loop SW Unit 23
- TBD Mag Seven Ct SW
- L3B3 Mag Seven Ct SW
- 822 Adams Ave NW
- TBD 15th St NW
- 1606 S Lake Irving Dr SW
- 3790 Country Field Ln SW
- 723 Irvine Ave NW
- 820 Mississippi Ave NW
- 522 9th St NW
- 1107 Park Ave NW
- 1101 Mississippi Ave NW
- 906 Irvine Ave NW
- 706 Minnesota Ave NW
- 1108 America Ave NW
- 1428 Park Ave NW
- 1019 Beltrami Ave NW
- 1123 Beltrami Ave NW
- 1108 Beltrami Ave NW
- 1101 Bemidji Ave N
- 2002 Deep Rock Loop SW
- 2006 Deep Rock Loop SW
- 2005 Deep Rock Loop SW
- 2010 Deep Rock Loop SW
- 2009 Deep Rock Loop SW Unit 28
- 2009 Deep Rock Loop SW
- 1924 Deep Rock Loop SW
- 2005 Deep Rock Loop SW
- 2013 Deep Rock Loop SW Unit 29
- 2013 Deep Rock Loop SW
- 2014 2014 Deep Rock Loop Unit 11
- 2014 Deep Rock Loop SW
- 1913 1913 Deep Rock Loop SW
- 1911 1911 Deep Rock Loop SW
- 1924 Deep Rock Loop SW
- 1924 Deep Rock Loop SW
- 2017 Deep Rock Loop SW Unit 30
- 2017 Deep Rock Loop SW
- 1913 Deep Rock Loop SW
- 2009 2009 Deep Rock Loop SW
Your Personal Tour Guide
Ask me questions while you tour the home.