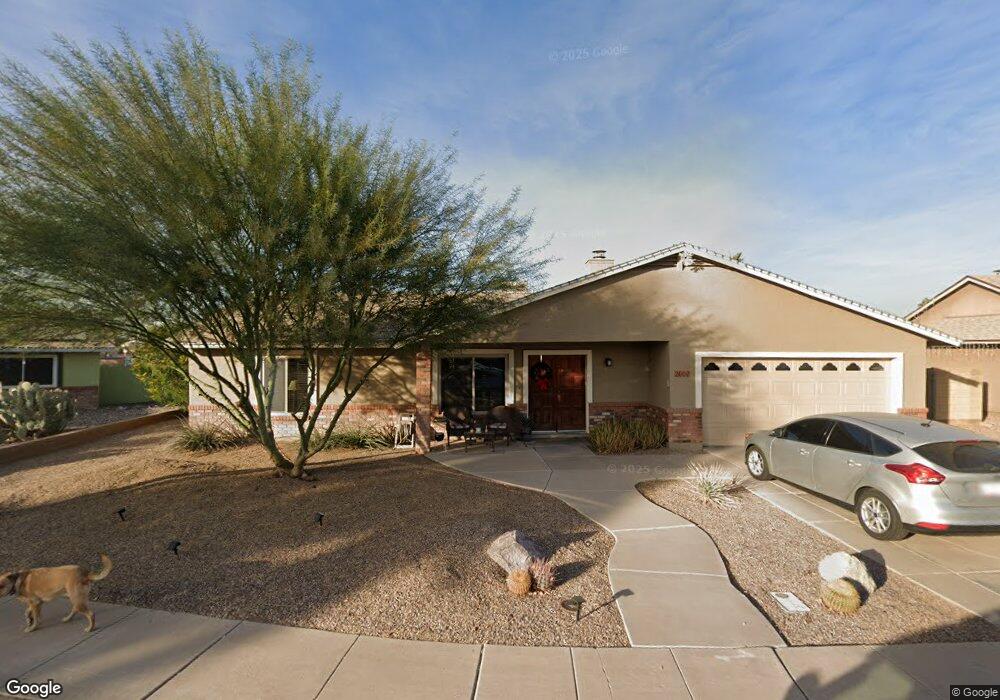
2002 E Boston St Chandler, AZ 85225
East Chandler NeighborhoodEstimated Value: $394,093 - $482,000
3
Beds
2
Baths
1,706
Sq Ft
$258/Sq Ft
Est. Value
About This Home
This home is located at 2002 E Boston St, Chandler, AZ 85225 and is currently estimated at $439,773, approximately $257 per square foot. 2002 E Boston St is a home located in Maricopa County with nearby schools including Chandler Traditional Academy-Humphrey, Willis Junior High School, and BASIS Chandler Primary North Campus.
Ownership History
Date
Name
Owned For
Owner Type
Purchase Details
Closed on
Oct 5, 2009
Sold by
Chambers Reda M and Chambers Jeffrey T
Bought by
Chambers Jeffrey T and Chambers Reda M
Current Estimated Value
Home Financials for this Owner
Home Financials are based on the most recent Mortgage that was taken out on this home.
Original Mortgage
$102,225
Outstanding Balance
$66,955
Interest Rate
5.14%
Mortgage Type
New Conventional
Estimated Equity
$372,818
Purchase Details
Closed on
Nov 7, 2003
Sold by
Zavala Javier R
Bought by
Chambers Jeffrey T and Jenniges Reda H
Home Financials for this Owner
Home Financials are based on the most recent Mortgage that was taken out on this home.
Original Mortgage
$110,900
Interest Rate
5.72%
Mortgage Type
New Conventional
Purchase Details
Closed on
Oct 29, 1998
Sold by
Rozinski John M and Rozinski Carol M
Bought by
Zavala Javier R
Create a Home Valuation Report for This Property
The Home Valuation Report is an in-depth analysis detailing your home's value as well as a comparison with similar homes in the area
Home Values in the Area
Average Home Value in this Area
Purchase History
| Date | Buyer | Sale Price | Title Company |
|---|---|---|---|
| Chambers Jeffrey T | -- | Lsi Title | |
| Chambers Jeffrey T | $142,000 | Security Title Agency | |
| Zavala Javier R | $109,900 | Lawyers Title Of Arizona Inc |
Source: Public Records
Mortgage History
| Date | Status | Borrower | Loan Amount |
|---|---|---|---|
| Open | Chambers Jeffrey T | $102,225 | |
| Closed | Chambers Jeffrey T | $110,900 |
Source: Public Records
Tax History Compared to Growth
Tax History
| Year | Tax Paid | Tax Assessment Tax Assessment Total Assessment is a certain percentage of the fair market value that is determined by local assessors to be the total taxable value of land and additions on the property. | Land | Improvement |
|---|---|---|---|---|
| 2025 | $1,359 | $17,440 | -- | -- |
| 2024 | $1,312 | $16,610 | -- | -- |
| 2023 | $1,312 | $33,510 | $6,700 | $26,810 |
| 2022 | $1,266 | $25,610 | $5,120 | $20,490 |
| 2021 | $1,327 | $24,580 | $4,910 | $19,670 |
| 2020 | $1,321 | $22,410 | $4,480 | $17,930 |
| 2019 | $1,271 | $20,070 | $4,010 | $16,060 |
| 2018 | $1,230 | $18,080 | $3,610 | $14,470 |
| 2017 | $1,147 | $16,320 | $3,260 | $13,060 |
| 2016 | $1,105 | $15,410 | $3,080 | $12,330 |
| 2015 | $1,070 | $14,460 | $2,890 | $11,570 |
Source: Public Records
Map
Nearby Homes
- 2010 E Butler St
- 111 N Soho Place
- 83 N Amber Ct
- 60 S Willow Creek St
- 2109 E Cindy St
- 25 N Cottonwood St Unit 41
- 195 N Cottonwood St Unit 21
- 2214 E Frye Rd
- 333 S Cooper Rd
- 1664 E Buffalo Cir
- 155 N Lakeview Blvd Unit 208
- 155 N Lakeview Blvd Unit 108
- 155 N Lakeview Blvd Unit 260
- 155 N Lakeview Blvd Unit 204
- 1731 E Folley Ct
- 6 S 132nd St
- 505 S Soho Ln Unit 30
- 382 N Ashley Dr
- 1605 E Chandler Blvd Unit 26
- 76 N 133rd St
- 2004 E Boston St
- 108 S Eucalyptus Place
- 2008 E Boston St
- 2001 E Boston St
- 112 S Eucalyptus Place
- 2005 E Boston St
- 99 N Cooper Rd Unit 144
- 99 N Cooper Rd Unit 156
- 99 N Cooper Rd Unit 145
- 99 N Cooper Rd Unit 123
- 99 N Cooper Rd Unit 128
- 99 N Cooper Rd Unit 139
- 99 N Cooper Rd Unit 146
- 99 N Cooper Rd Unit 154
- 99 N Cooper Rd Unit 140
- 99 N Cooper Rd Unit 124
- 99 N Cooper Rd Unit 152
- 99 N Cooper Rd Unit 157
- 99 N Cooper Rd Unit 151
- 99 N Cooper Rd Unit 132