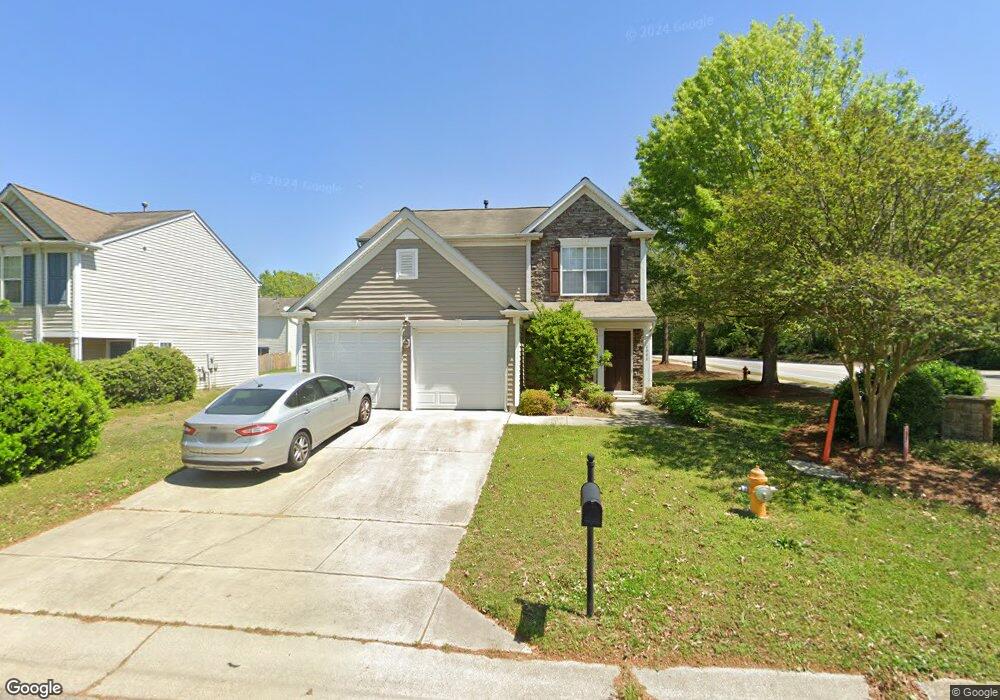
2002 Groundwater Place Raleigh, NC 27610
Hedingham NeighborhoodEstimated Value: $325,000 - $333,000
3
Beds
3
Baths
1,583
Sq Ft
$207/Sq Ft
Est. Value
About This Home
This home is located at 2002 Groundwater Place, Raleigh, NC 27610 and is currently estimated at $327,823, approximately $207 per square foot. 2002 Groundwater Place is a home located in Wake County with nearby schools including Beaverdam Elementary School, River Bend Middle, and Knightdale High.
Ownership History
Date
Name
Owned For
Owner Type
Purchase Details
Closed on
Jun 30, 2020
Sold by
Walston Grady and Walston Bobby M
Bought by
Opendoor Property Trust I
Current Estimated Value
Purchase Details
Closed on
May 21, 2013
Sold by
Ratcliff Quincy D
Bought by
American Homes 4 Rent Properties Five Ll
Purchase Details
Closed on
Oct 30, 2007
Sold by
Zdenek Jeff and Zdenek Jennie
Bought by
Ratcliff Quincy D
Home Financials for this Owner
Home Financials are based on the most recent Mortgage that was taken out on this home.
Original Mortgage
$160,000
Interest Rate
6.27%
Mortgage Type
Purchase Money Mortgage
Purchase Details
Closed on
Mar 23, 2007
Sold by
Dunston Theardis
Bought by
Zdenek Jeff and Zdenek Jennie
Create a Home Valuation Report for This Property
The Home Valuation Report is an in-depth analysis detailing your home's value as well as a comparison with similar homes in the area
Home Values in the Area
Average Home Value in this Area
Purchase History
| Date | Buyer | Sale Price | Title Company |
|---|---|---|---|
| Opendoor Property Trust I | $205,000 | None Available | |
| American Homes 4 Rent Properties Five Ll | $153,000 | None Available | |
| Ratcliff Quincy D | $160,000 | None Available | |
| Zdenek Jeff | $140,072 | None Available |
Source: Public Records
Mortgage History
| Date | Status | Borrower | Loan Amount |
|---|---|---|---|
| Previous Owner | Ratcliff Quincy D | $160,000 |
Source: Public Records
Tax History Compared to Growth
Tax History
| Year | Tax Paid | Tax Assessment Tax Assessment Total Assessment is a certain percentage of the fair market value that is determined by local assessors to be the total taxable value of land and additions on the property. | Land | Improvement |
|---|---|---|---|---|
| 2025 | $2,771 | $315,391 | $80,000 | $235,391 |
| 2024 | $2,759 | $315,391 | $80,000 | $235,391 |
| 2023 | $2,306 | $209,704 | $44,000 | $165,704 |
| 2022 | $2,143 | $209,704 | $44,000 | $165,704 |
| 2021 | $2,060 | $209,704 | $44,000 | $165,704 |
| 2020 | $2,023 | $209,704 | $44,000 | $165,704 |
| 2019 | $1,858 | $158,634 | $34,000 | $124,634 |
| 2018 | $1,753 | $158,634 | $34,000 | $124,634 |
| 2017 | $1,670 | $158,634 | $34,000 | $124,634 |
| 2016 | $1,636 | $158,634 | $34,000 | $124,634 |
| 2015 | $1,672 | $159,502 | $34,000 | $125,502 |
| 2014 | $1,586 | $159,502 | $34,000 | $125,502 |
Source: Public Records
Map
Nearby Homes
- 2018 Groundwater Place
- 5340 Big Bass Dr
- 5335 Big Bass Dr
- 5345 Big Bass Dr
- 1526 Roaring Rapids Rd
- 2344 Lazy River Dr
- 4973 Royal Adelaide Way
- 5435 Big Bass Dr
- 2330 Lazy River Dr
- 1713 Kingston Heath Way
- 1500 Crescent Townes Way
- 1502 Crescent Townes Way
- 1504 Crescent Townes Way
- 1506 Crescent Townes Way
- 1501 Crescent Townes Way
- 1503 Crescent Townes Way
- 1510 Crescent Townes Way
- 1505 Crescent Townes Way
- Savannah Plan at Crescent Townes
- 1559 Crescent Townes Way
- 5035 Raleigh Beach Rd
- 2006 Groundwater Place
- 2010 Groundwater Place
- 2003 Swimming Hole Cir
- 2007 Swimming Hole Cir
- 2001 Waters Dr
- 2011 Swimming Hole Cir
- 2014 Groundwater Place
- 2003 Groundwater Place
- 5031 Raleigh Beach Rd
- 2007 Groundwater Place
- 2015 Swimming Hole Cir
- 2011 Groundwater Place
- 2015 Groundwater Place
- 2019 Swimming Hole Cir
- 2022 Groundwater Place
- 2019 Groundwater Place
- 2023 Swimming Hole Cir
- 2016 Swimming Hole Cir
- 2023 Groundwater Place