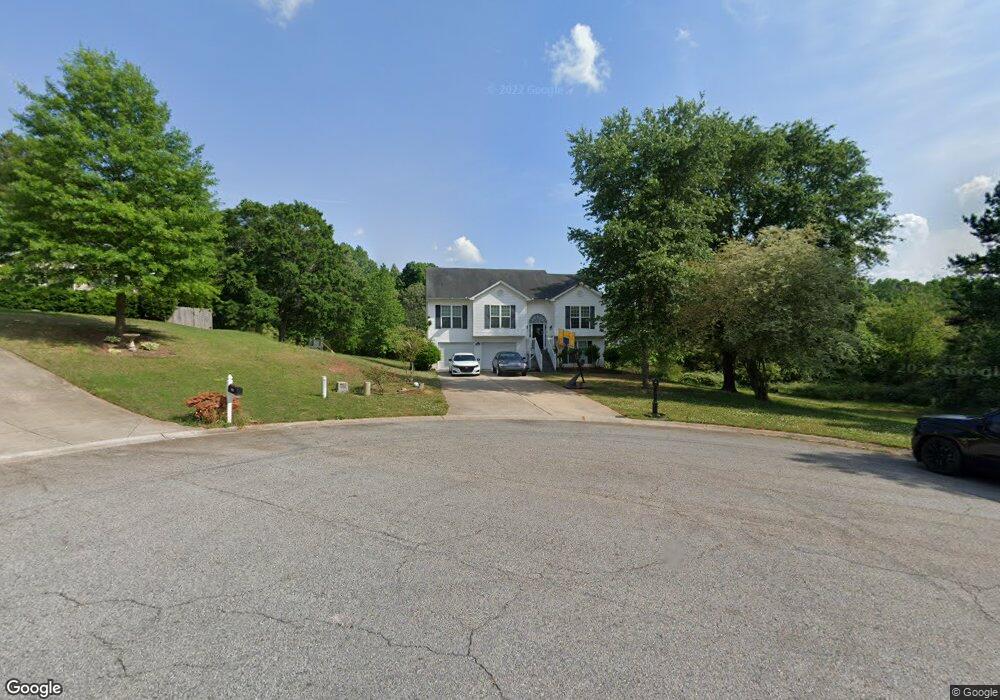
2002 Kirkland Cir Statham, GA 30666
Estimated Value: $324,000 - $404,000
3
Beds
2
Baths
2,539
Sq Ft
$142/Sq Ft
Est. Value
About This Home
This home is located at 2002 Kirkland Cir, Statham, GA 30666 and is currently estimated at $361,352, approximately $142 per square foot. 2002 Kirkland Cir is a home located in Barrow County with nearby schools including Statham Elementary School, Bear Creek Middle School, and Winder-Barrow High School.
Ownership History
Date
Name
Owned For
Owner Type
Purchase Details
Closed on
Jan 29, 2018
Sold by
Igloo Series Ii Reo Llc
Bought by
Monderiko Hudson
Current Estimated Value
Home Financials for this Owner
Home Financials are based on the most recent Mortgage that was taken out on this home.
Original Mortgage
$169,696
Outstanding Balance
$143,717
Interest Rate
3.99%
Mortgage Type
New Conventional
Estimated Equity
$217,635
Purchase Details
Closed on
May 15, 2017
Sold by
Garbut Sharese
Bought by
Igloo Series Ii Reo Llc
Purchase Details
Closed on
Jul 21, 2006
Sold by
Southfork Hms Inc
Bought by
Garbut Sharese and Garbut Roy
Home Financials for this Owner
Home Financials are based on the most recent Mortgage that was taken out on this home.
Original Mortgage
$145,156
Interest Rate
9.64%
Mortgage Type
New Conventional
Purchase Details
Closed on
Dec 19, 2005
Sold by
Daniel'S Crossing Llc
Bought by
Southfork Homes Inc
Purchase Details
Closed on
Aug 26, 2004
Bought by
Daniel'S Crossing Llc
Create a Home Valuation Report for This Property
The Home Valuation Report is an in-depth analysis detailing your home's value as well as a comparison with similar homes in the area
Home Values in the Area
Average Home Value in this Area
Purchase History
| Date | Buyer | Sale Price | Title Company |
|---|---|---|---|
| Monderiko Hudson | $167,250 | -- | |
| Igloo Series Ii Reo Llc | $145,156 | -- | |
| Garbut Sharese | $145,200 | -- | |
| Southfork Homes Inc | $1,147,000 | -- | |
| Daniel'S Crossing Llc | -- | -- |
Source: Public Records
Mortgage History
| Date | Status | Borrower | Loan Amount |
|---|---|---|---|
| Open | Monderiko Hudson | $169,696 | |
| Previous Owner | Garbut Sharese | $145,156 |
Source: Public Records
Tax History Compared to Growth
Tax History
| Year | Tax Paid | Tax Assessment Tax Assessment Total Assessment is a certain percentage of the fair market value that is determined by local assessors to be the total taxable value of land and additions on the property. | Land | Improvement |
|---|---|---|---|---|
| 2024 | $3,401 | $136,070 | $20,400 | $115,670 |
| 2023 | $3,298 | $132,070 | $16,000 | $116,070 |
| 2022 | $2,892 | $99,265 | $16,000 | $83,265 |
| 2021 | $2,312 | $74,176 | $16,000 | $58,176 |
| 2020 | $2,316 | $74,176 | $16,000 | $58,176 |
| 2019 | $2,137 | $67,536 | $16,000 | $51,536 |
| 2018 | $1,960 | $61,848 | $13,200 | $48,648 |
| 2017 | $1,276 | $43,814 | $11,200 | $32,614 |
| 2016 | $1,230 | $42,540 | $11,200 | $31,340 |
| 2015 | $1,245 | $42,876 | $11,200 | $31,676 |
| 2014 | $1,132 | $38,872 | $6,860 | $32,012 |
| 2013 | -- | $36,826 | $6,860 | $29,966 |
Source: Public Records
Map
Nearby Homes
- 410 Tori Dr
- 2070 Dooley Town Rd
- 1849 Dooley Town Rd
- 1816 Oak Spring St
- 226 Baker St
- 29 Nunnally Rd SE
- 235 1st St
- 1593 Highway 82
- 453 Fernwood Cir
- 509 Greenfield Dr Unit 3
- 1679 Atlanta Hwy SE
- 79 Lyles Corner
- 315 Paige Way
- 80 Charlotte Cir
- 74 Charlotte Cir
- 384 Sunset Dr
- 190 Charlotte Cir
- 43 Lyles Corner
- 1907 Broad St
- 390 Sunset Dr
- 2000 Kirkland Cir
- 2001 Kirkland Cir
- 2003 Kirkland Cir
- 2005 Kirkland Cir
- 2119 Kirkland Dr
- 2121 Kirkland Dr
- 2117 Kirkland Dr
- 2125 Kirkland Dr
- 2115 Kirkland Dr
- 2127 Kirkland Dr
- 2113 Kirkland Dr
- 2007 Kirkland Cir
- 1490 Dooley Town Dr
- 2109 Kirkland Dr
- 2131 Kirkland Dr
- 1496 Dooley Town Dr
- 1502 Dooley Town Dr
- 2120 Kirkland Dr
- 2122 Kirkland Dr
- 2118 Kirkland Dr