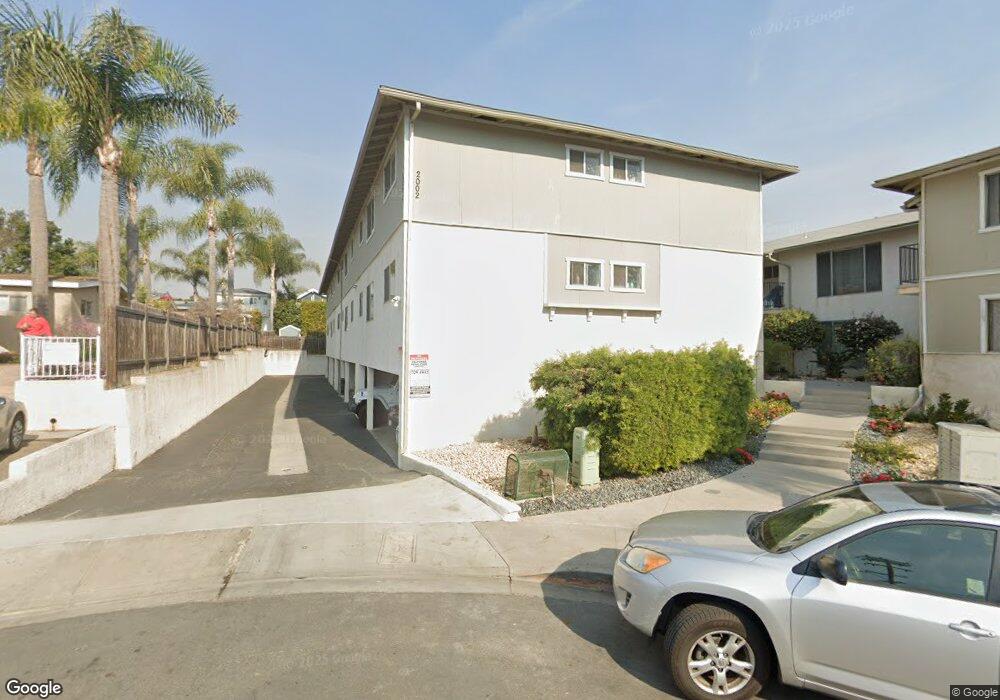
2002 Missouri St Unit 9 San Diego, CA 92109
Pacific Beach NeighborhoodEstimated Value: $687,003 - $784,000
2
Beds
2
Baths
983
Sq Ft
$745/Sq Ft
Est. Value
About This Home
This home is located at 2002 Missouri St Unit 9, San Diego, CA 92109 and is currently estimated at $732,501, approximately $745 per square foot. 2002 Missouri St Unit 9 is a home located in San Diego County with nearby schools including Sessions Elementary School, Pacific Beach Middle, and Mission Bay High School.
Ownership History
Date
Name
Owned For
Owner Type
Purchase Details
Closed on
Dec 21, 2022
Sold by
Wilson James M
Bought by
Wilson Family Trust
Current Estimated Value
Purchase Details
Closed on
Sep 29, 2010
Sold by
Rumerman Joel and Rumerman Stacey Marie
Bought by
Wilson James M
Home Financials for this Owner
Home Financials are based on the most recent Mortgage that was taken out on this home.
Original Mortgage
$239,999
Interest Rate
4.33%
Mortgage Type
New Conventional
Purchase Details
Closed on
Jan 19, 2005
Sold by
Davis Andrew M and Davis Takako
Bought by
Rumerman Joel
Home Financials for this Owner
Home Financials are based on the most recent Mortgage that was taken out on this home.
Original Mortgage
$339,120
Interest Rate
5.12%
Mortgage Type
Unknown
Create a Home Valuation Report for This Property
The Home Valuation Report is an in-depth analysis detailing your home's value as well as a comparison with similar homes in the area
Home Values in the Area
Average Home Value in this Area
Purchase History
| Date | Buyer | Sale Price | Title Company |
|---|---|---|---|
| Wilson Family Trust | -- | -- | |
| Wilson James M | $300,000 | Corinthian Title Company | |
| Rumerman Joel | $425,000 | Fidelity National Title Co |
Source: Public Records
Mortgage History
| Date | Status | Borrower | Loan Amount |
|---|---|---|---|
| Previous Owner | Wilson James M | $239,999 | |
| Previous Owner | Rumerman Joel | $339,120 | |
| Closed | Rumerman Joel | $31,000 |
Source: Public Records
Tax History Compared to Growth
Tax History
| Year | Tax Paid | Tax Assessment Tax Assessment Total Assessment is a certain percentage of the fair market value that is determined by local assessors to be the total taxable value of land and additions on the property. | Land | Improvement |
|---|---|---|---|---|
| 2025 | $4,659 | $384,339 | $271,369 | $112,970 |
| 2024 | $4,659 | $376,804 | $266,049 | $110,755 |
| 2023 | $4,557 | $369,417 | $260,833 | $108,584 |
| 2022 | $4,436 | $362,174 | $255,719 | $106,455 |
| 2021 | $4,406 | $355,073 | $250,705 | $104,368 |
| 2020 | $4,352 | $351,433 | $248,135 | $103,298 |
| 2019 | $4,275 | $344,543 | $243,270 | $101,273 |
| 2018 | $3,998 | $337,788 | $238,500 | $99,288 |
| 2017 | $3,903 | $331,166 | $233,824 | $97,342 |
| 2016 | $3,841 | $324,674 | $229,240 | $95,434 |
| 2015 | $3,784 | $319,798 | $225,797 | $94,001 |
| 2014 | $3,725 | $313,534 | $221,374 | $92,160 |
Source: Public Records
Map
Nearby Homes
- 2002 Missouri St Unit 6
- 4750 Noyes St Unit 110
- 4730 Noyes St Unit 106
- 4801 Academy St
- 4813-11 Academy (Lot 16)
- 4823-21 Academy (Lot 17)
- 2036-38 Emerald St
- 2128 Missouri St
- 2045 Emerald St Unit 3
- 4600 Lamont St Unit 4-130
- 4600 Lamont St Unit 4-103
- 1828 Diamond St Unit 3
- 1978 Beryl St
- 1818 Diamond St
- 1816 Diamond St
- 2114 Felspar St
- 1855 Diamond St Unit 5-309
- 1775 Diamond St Unit 220
- 1801 Diamond St Unit 3-108
- 1885 Diamond St Unit 2-235
- 2002 Missouri St
- 2002 Missouri St Unit 14
- 2002 Missouri St Unit 8
- 2002 Missouri St Unit 5
- 2002 Missouri St Unit 12
- 2002 Missouri St Unit 10
- 2002 Missouri St Unit 1
- 2002 Missouri St Unit 3
- 2002 Missouri St Unit 16
- 2002 Missouri St Unit 7
- 2002 Missouri St Unit 15
- 2002 Missouri St Unit 13
- 2002 Missouri St Unit 11
- 2002 Missouri St Unit 4
- 2002 Missouri St Unit 2
- 1974 Missouri St
- 1980 Missouri St
- 1978 Missouri St
- 1976 Missouri St
- 4774 Academy Place