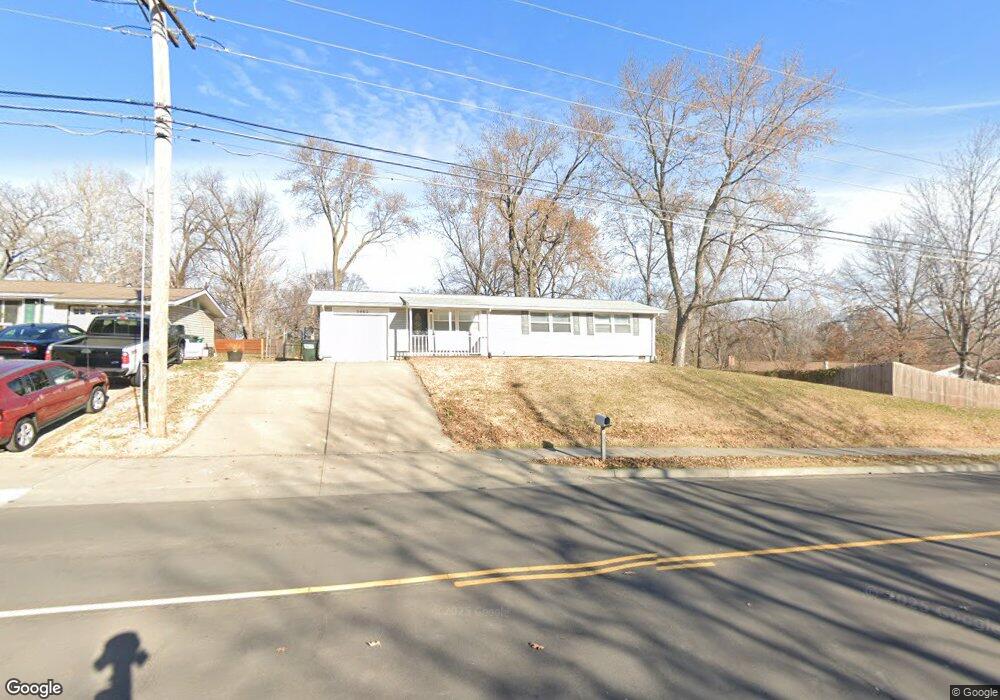
2002 NE Englewood Rd Kansas City, MO 64118
Estimated Value: $208,000 - $238,000
3
Beds
1
Bath
1,125
Sq Ft
$197/Sq Ft
Est. Value
About This Home
This home is located at 2002 NE Englewood Rd, Kansas City, MO 64118 and is currently estimated at $222,134, approximately $197 per square foot. 2002 NE Englewood Rd is a home located in Clay County with nearby schools including Oakwood Manor Elementary School, Antioch Middle School, and Oak Park High School.
Ownership History
Date
Name
Owned For
Owner Type
Purchase Details
Closed on
Dec 21, 2021
Sold by
Bonura Christopher D and Oleary Christopher D
Bought by
Rf2wy Llc
Current Estimated Value
Purchase Details
Closed on
Nov 21, 2013
Sold by
Angotti Carl E and Angotti Shelli R
Bought by
Leary Christopher D O
Home Financials for this Owner
Home Financials are based on the most recent Mortgage that was taken out on this home.
Original Mortgage
$93,279
Interest Rate
4.25%
Mortgage Type
FHA
Purchase Details
Closed on
Mar 27, 2012
Sold by
Lindsay Sandra L and Lindsay Thomas W
Bought by
Angotti Carl E and Angotti Shelli R
Home Financials for this Owner
Home Financials are based on the most recent Mortgage that was taken out on this home.
Original Mortgage
$92,591
Interest Rate
3.87%
Mortgage Type
FHA
Create a Home Valuation Report for This Property
The Home Valuation Report is an in-depth analysis detailing your home's value as well as a comparison with similar homes in the area
Home Values in the Area
Average Home Value in this Area
Purchase History
| Date | Buyer | Sale Price | Title Company |
|---|---|---|---|
| Rf2wy Llc | -- | Titleone Agency Inc | |
| Leary Christopher D O | -- | Continental Title | |
| Angotti Carl E | -- | None Available |
Source: Public Records
Mortgage History
| Date | Status | Borrower | Loan Amount |
|---|---|---|---|
| Previous Owner | Leary Christopher D O | $93,279 | |
| Previous Owner | Angotti Carl E | $92,591 |
Source: Public Records
Tax History Compared to Growth
Tax History
| Year | Tax Paid | Tax Assessment Tax Assessment Total Assessment is a certain percentage of the fair market value that is determined by local assessors to be the total taxable value of land and additions on the property. | Land | Improvement |
|---|---|---|---|---|
| 2025 | $1,544 | $23,540 | -- | -- |
| 2024 | $1,544 | $21,360 | -- | -- |
| 2023 | $1,534 | $21,360 | $0 | $0 |
| 2022 | $3,712 | $18,300 | $0 | $0 |
| 2021 | $1,359 | $18,297 | $4,750 | $13,547 |
| 2020 | $1,290 | $15,810 | $0 | $0 |
| 2019 | $1,287 | $15,808 | $3,420 | $12,388 |
| 2018 | $1,222 | $14,310 | $0 | $0 |
| 2017 | $1,210 | $14,310 | $2,850 | $11,460 |
| 2016 | $1,210 | $14,310 | $2,850 | $11,460 |
| 2015 | $1,210 | $14,310 | $2,850 | $11,460 |
| 2014 | $1,293 | $15,070 | $2,850 | $12,220 |
Source: Public Records
Map
Nearby Homes
- 5713 N Woodland Ave
- 5708 N Woodland Ave
- 5521 N Wayne Ave
- 5530 N Flora Ave
- 2204 NE 58th Terrace
- 5425 N Flora Ave
- 1314 NE 58th St
- 2506 NE 53rd St
- 2801 NE 56th Terrace
- 2802 NE 56th Terrace
- 5440 N Tracy Ave
- 1608 NE 60th Terrace
- 5515 N Troost Ave
- 1200 NE 57th Terrace
- 5229 N Virginia Ave
- 2903 NE 56th Terrace
- 2300 NE 61st St
- 2101 NE 62nd St
- 1504 NE 51st St
- 5103 NE Marvin Rd
- 2000 NE Englewood Rd
- 5600 N Garfield Ave
- 5604 N Euclid Ave
- 5602 N Garfield Ave
- 1910 NE Englewood Rd
- 5606 N Euclid Ave
- 1908 NE Englewood Rd
- 5606 N Garfield Ave
- 5601 N Garfield Ave
- 5603 N Garfield Ave
- 5608 N Euclid Ave
- 5605 N Garfield Ave
- 5609 N Euclid Ave
- 5608 N Garfield Ave
- 2015 NE Englewood Rd
- 5607 N Garfield Ave
- 5610 N Euclid Ave
- 5600 N Brooklyn Ave
- 5602 N Brooklyn Ave
- 5611 N Euclid Ave