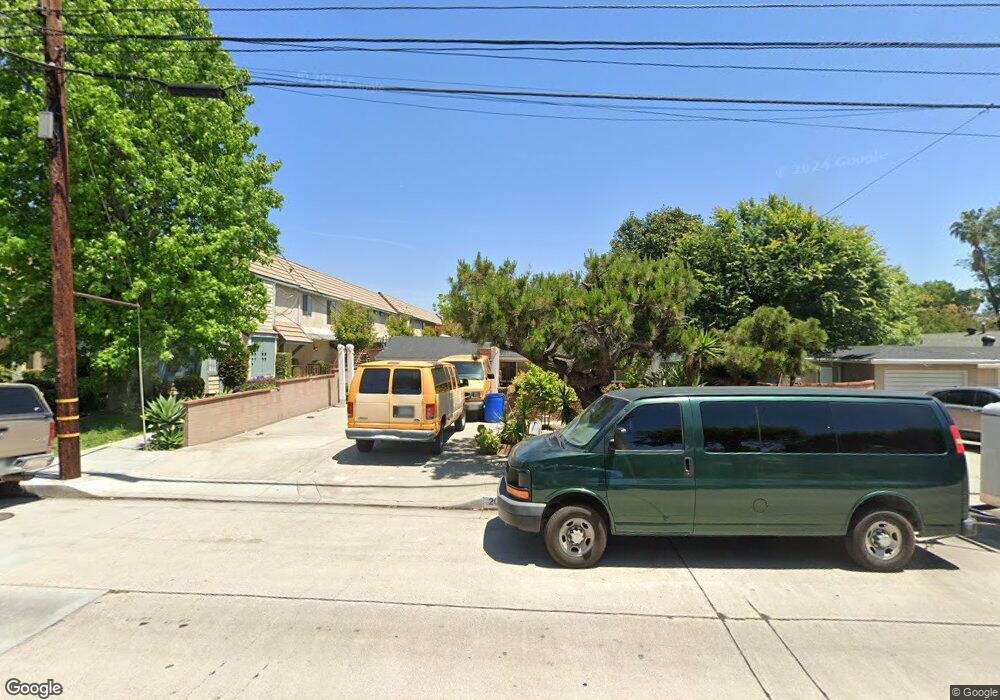
2002 Peck Rd Monrovia, CA 91016
Estimated Value: $848,000 - $1,021,000
3
Beds
2
Baths
1,522
Sq Ft
$607/Sq Ft
Est. Value
About This Home
This home is located at 2002 Peck Rd, Monrovia, CA 91016 and is currently estimated at $924,247, approximately $607 per square foot. 2002 Peck Rd is a home located in Los Angeles County with nearby schools including Bradoaks Elementary Science Academy, Santa Fe Computer Science Magnet, and Monrovia High School.
Ownership History
Date
Name
Owned For
Owner Type
Purchase Details
Closed on
Feb 22, 2009
Sold by
Tellez Victor C
Bought by
Hernandez Guadalupe
Current Estimated Value
Purchase Details
Closed on
Sep 28, 2000
Sold by
Hernandez Guadalupe
Bought by
Tellez Victor C
Home Financials for this Owner
Home Financials are based on the most recent Mortgage that was taken out on this home.
Original Mortgage
$147,600
Interest Rate
7.96%
Purchase Details
Closed on
Sep 5, 2000
Sold by
Zlotorowicz Leonard
Bought by
Tellez Victor C
Home Financials for this Owner
Home Financials are based on the most recent Mortgage that was taken out on this home.
Original Mortgage
$147,600
Interest Rate
7.96%
Purchase Details
Closed on
Jul 21, 1999
Sold by
Zlotor Hedwig
Bought by
Zlotorowicz Leonard
Purchase Details
Closed on
Dec 28, 1998
Sold by
Zlotorowicz Leonard
Bought by
Zlotorowicz Leonard and Zlotorowicz Ewa J
Create a Home Valuation Report for This Property
The Home Valuation Report is an in-depth analysis detailing your home's value as well as a comparison with similar homes in the area
Home Values in the Area
Average Home Value in this Area
Purchase History
| Date | Buyer | Sale Price | Title Company |
|---|---|---|---|
| Hernandez Guadalupe | -- | None Available | |
| Tellez Victor C | -- | Southland Title | |
| Tellez Victor C | $184,500 | Southland Title | |
| Zlotorowicz Leonard | -- | -- | |
| Zlotorowicz Leonard | -- | -- |
Source: Public Records
Mortgage History
| Date | Status | Borrower | Loan Amount |
|---|---|---|---|
| Previous Owner | Tellez Victor C | $147,600 | |
| Closed | Tellez Victor C | $18,450 |
Source: Public Records
Tax History
| Year | Tax Paid | Tax Assessment Tax Assessment Total Assessment is a certain percentage of the fair market value that is determined by local assessors to be the total taxable value of land and additions on the property. | Land | Improvement |
|---|---|---|---|---|
| 2025 | $4,664 | $339,017 | $188,344 | $150,673 |
| 2024 | $4,664 | $332,370 | $184,651 | $147,719 |
| 2023 | $4,556 | $325,854 | $181,031 | $144,823 |
| 2022 | $4,424 | $319,466 | $177,482 | $141,984 |
| 2021 | $4,436 | $313,202 | $174,002 | $139,200 |
| 2019 | $4,233 | $303,914 | $168,842 | $135,072 |
| 2018 | $4,086 | $297,956 | $165,532 | $132,424 |
| 2016 | $3,920 | $286,388 | $159,105 | $127,283 |
| 2015 | $3,835 | $282,088 | $156,716 | $125,372 |
| 2014 | $3,799 | $276,564 | $153,647 | $122,917 |
Source: Public Records
Map
Nearby Homes
- 151 E El Norte St
- 2118 Peck Rd
- 331 Genoa St Unit E
- 2338 Rochelle Ave
- 344 Pamela Rd
- 1131 S 10th Ave
- 616 W Duarte Rd
- 107 Brisbane St
- 420 Montana St
- 148 W Cherry Ave
- 492 Shrode Ave
- 714 Genoa St
- 1318 S 8th Ave
- 416 Jeffries Ave Unit 60
- 416 Jeffries Ave Unit 84
- 416 Jeffries Ave Unit 86
- 2548 Peck Rd Unit 39
- 1227 S 8th Ave
- 1408 S California Ave Unit C
- 1118 S 6th Ave
Your Personal Tour Guide
Ask me questions while you tour the home.