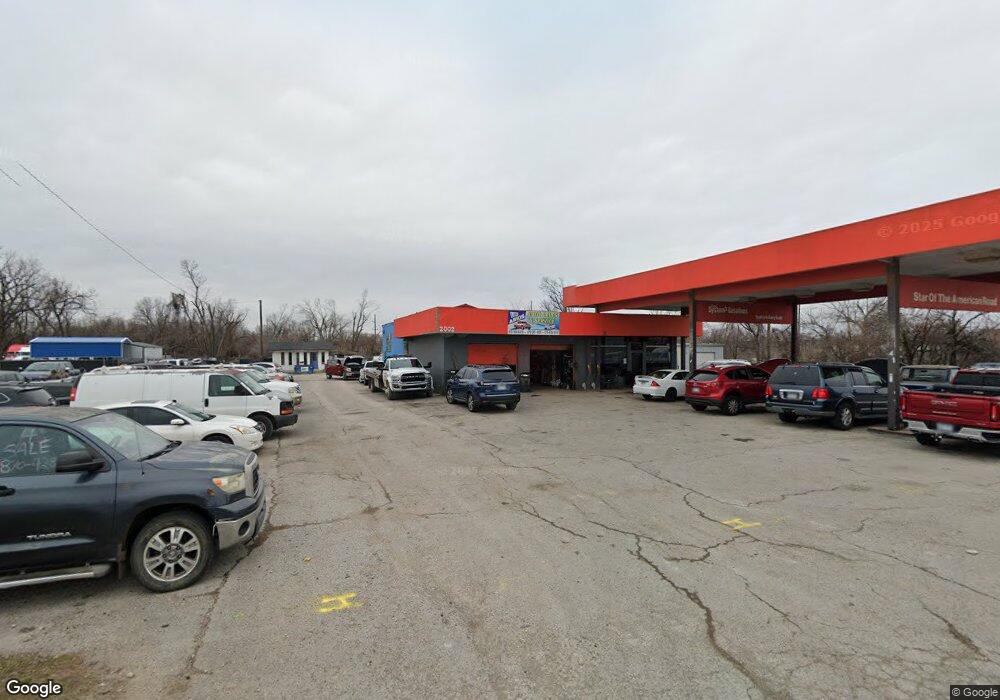
2002 S 8th St Rogers, AR 72758
--
Bed
--
Bath
3,540
Sq Ft
--
Built
About This Home
This home is located at 2002 S 8th St, Rogers, AR 72758. 2002 S 8th St is a home located in Benton County with nearby schools including Elza R. Tucker Elementary School, Elmwood Middle School, and Rogers High School.
Ownership History
Date
Name
Owned For
Owner Type
Purchase Details
Closed on
Nov 20, 2001
Bought by
Jeffcoat Jeffcoat 2 and Jeffcoat 7Ac
Purchase Details
Closed on
Oct 15, 2001
Bought by
Schwyhart Schwyhart 2 and Schwyhart 86Ac
Purchase Details
Closed on
Oct 12, 2001
Bought by
Hickman
Purchase Details
Closed on
Mar 13, 2001
Bought by
Hmg 4 Pc
Purchase Details
Closed on
Oct 16, 2000
Bought by
Johnson 4Pcl
Purchase Details
Closed on
Apr 5, 2000
Bought by
Hmg Hmg 1 and Hmg 37Ac
Purchase Details
Closed on
Dec 3, 1998
Bought by
Crawford Crawford 1 and Crawford 37Ac
Purchase Details
Closed on
Sep 15, 1997
Bought by
H M G Investments
Purchase Details
Closed on
Nov 21, 1996
Bought by
Thorton
Purchase Details
Closed on
Aug 9, 1996
Bought by
Thorton
Purchase Details
Closed on
Sep 7, 1995
Bought by
Hmg Invest
Purchase Details
Closed on
Sep 10, 1987
Bought by
Dynamic
Purchase Details
Closed on
Feb 12, 1986
Bought by
Dynamic
Create a Home Valuation Report for This Property
The Home Valuation Report is an in-depth analysis detailing your home's value as well as a comparison with similar homes in the area
Home Values in the Area
Average Home Value in this Area
Purchase History
| Date | Buyer | Sale Price | Title Company |
|---|---|---|---|
| Jeffcoat Jeffcoat 2 | $700,000 | -- | |
| Schwyhart Schwyhart 2 | $250,000 | -- | |
| Hickman | $250,000 | -- | |
| Hmg 4 Pc | -- | -- | |
| Johnson 4Pcl | $1,020,000 | -- | |
| Hmg Hmg 1 | -- | -- | |
| Crawford Crawford 1 | $400,000 | -- | |
| H M G Investments | -- | -- | |
| Thorton | -- | -- | |
| Thorton | $400,000 | -- | |
| Hmg Invest | $290,000 | -- | |
| Hmg Invest | -- | -- | |
| Dynamic | $80,000 | -- | |
| Shoops | -- | -- | |
| Dynamic | $80,000 | -- |
Source: Public Records
Tax History Compared to Growth
Tax History
| Year | Tax Paid | Tax Assessment Tax Assessment Total Assessment is a certain percentage of the fair market value that is determined by local assessors to be the total taxable value of land and additions on the property. | Land | Improvement |
|---|---|---|---|---|
| 2025 | $2,310 | $43,793 | $25,300 | $18,493 |
| 2024 | $2,066 | $43,793 | $25,300 | $18,493 |
| 2023 | $1,878 | $35,510 | $23,750 | $11,760 |
| 2022 | $1,953 | $35,510 | $23,750 | $11,760 |
| 2021 | $1,948 | $35,510 | $23,750 | $11,760 |
| 2020 | $2,053 | $37,400 | $26,540 | $10,860 |
| 2019 | $2,053 | $37,400 | $26,540 | $10,860 |
| 2018 | $2,053 | $37,400 | $26,540 | $10,860 |
| 2017 | $1,941 | $37,400 | $26,540 | $10,860 |
| 2016 | $1,941 | $37,400 | $26,540 | $10,860 |
| 2015 | $2,451 | $46,340 | $22,300 | $24,040 |
| 2014 | $2,451 | $46,340 | $22,300 | $24,040 |
Source: Public Records
Map
Nearby Homes
- 1904 S 8th St
- 9.02 Acres W Dyke Rd
- 0 Hwy 94 Dr Unit 1239629
- 825 W Linden St
- 1008 W Linden St
- 1012 W Linden St
- 2006 S 11th St
- 1014 W Linden St
- 2221 S 9th St
- 2004 S 12th St
- 2011 S 13th St
- 1100 W Banz Rd
- 122 E Glendale Ln
- 1308 & 1310 W Lela St
- 906 W Geneva St
- 1325 W New Hope Rd
- 1902 S 16th St
- 1303 W Banz Rd
- 2006 S 17th St
- 1003 W Price Ln
- 2000 S 8th St
- 2303 U S 71b
- 0 U S 71b
- 2004 S 8th St
- 8 Duplicate Listing
- 1920 S 8th St
- 2008 S 8th St
- 1908 S 8th St
- 2003 S 8th St
- 2003 S 8th St Unit 2
- 2003 S 8th St
- 2303 W Beacon Circle Dr
- 1918 S 9th St
- 2304 Beacon Circle Dr
- 2101 S 8th St
- 1904 S 8th St Unit 29
- 1904 S 8th St Unit 24
- 1904 S 8th St Unit 21
- 609 W Dyke Rd
- 605 W Dyke Rd