Estimated Value: $103,000 - $132,000
4
Beds
2
Baths
1,850
Sq Ft
$63/Sq Ft
Est. Value
About This Home
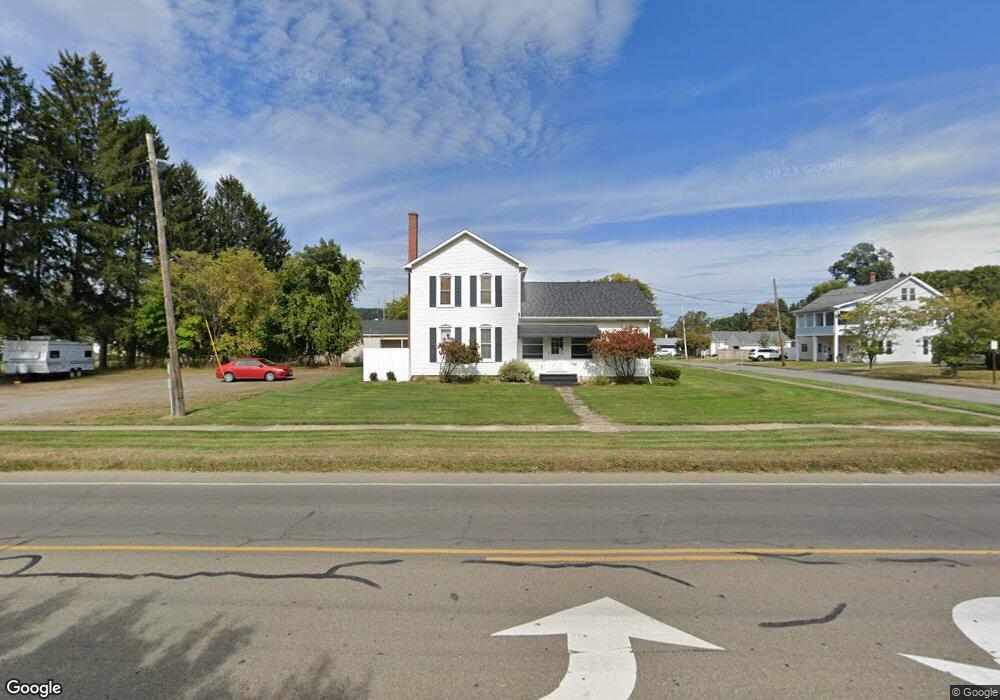
This home is located at 2002 W State St, Olean, NY 14760 and is currently estimated at $116,689, approximately $63 per square foot. 2002 W State St is a home located in Cattaraugus County with nearby schools including Olean Intermediate-Middle School, Olean Senior High School, and Southern Tier Catholic School.
Ownership History
Date
Name
Owned For
Owner Type
Purchase Details
Closed on
Jul 31, 2023
Sold by
Dwaileebe Charles J
Bought by
Dwaileebe Charles J and Dwaileebe Lanette M
Current Estimated Value
Purchase Details
Closed on
Oct 3, 2019
Sold by
Dwaileebe Charles J
Bought by
Spring Allyson M
Purchase Details
Closed on
Nov 16, 2006
Sold by
Kettler Estate Clarence
Bought by
Dwaileebe Charles
Create a Home Valuation Report for This Property
The Home Valuation Report is an in-depth analysis detailing your home's value as well as a comparison with similar homes in the area
Home Values in the Area
Average Home Value in this Area
Purchase History
| Date | Buyer | Sale Price | Title Company |
|---|---|---|---|
| Dwaileebe Charles J | -- | None Available | |
| Spring Allyson M | -- | -- | |
| Dwaileebe Charles | $50,000 | Daniel R. Palumbo |
Source: Public Records
Tax History
| Year | Tax Paid | Tax Assessment Tax Assessment Total Assessment is a certain percentage of the fair market value that is determined by local assessors to be the total taxable value of land and additions on the property. | Land | Improvement |
|---|---|---|---|---|
| 2025 | $3,661 | $57,900 | $5,000 | $52,900 |
| 2024 | $3,661 | $57,900 | $5,000 | $52,900 |
| 2023 | $2,180 | $57,900 | $5,000 | $52,900 |
| 2022 | $2,211 | $57,900 | $5,000 | $52,900 |
| 2021 | $2,275 | $57,900 | $5,000 | $52,900 |
| 2020 | $1,650 | $57,900 | $5,000 | $52,900 |
| 2019 | $869 | $57,900 | $5,000 | $52,900 |
| 2018 | $2,482 | $57,900 | $5,000 | $52,900 |
| 2017 | $1,671 | $57,900 | $5,000 | $52,900 |
| 2016 | $1,627 | $57,900 | $5,000 | $52,900 |
| 2015 | -- | $57,900 | $5,000 | $52,900 |
| 2014 | -- | $57,900 | $5,000 | $52,900 |
Source: Public Records
Map
Nearby Homes
- 108 S 18th St
- 111 S 18th St
- 113 S 18th St
- 114 S 17th St
- 1705 W State St
- 121 S 17th St
- 224 S 16th St
- 132 N 15th St
- 204 N 24th St
- 216 N 14th St
- 135 N 12th St
- 129 S 11th St
- 207 N 11th St
- 1205 W Sullivan St
- 1102 Anderson Ave
- 3019 Nys Route 417
- 1013 W Sullivan St
- 3031 Nys Route 417
- 3033 W State St
- 118 S 7th St
Your Personal Tour Guide
Ask me questions while you tour the home.