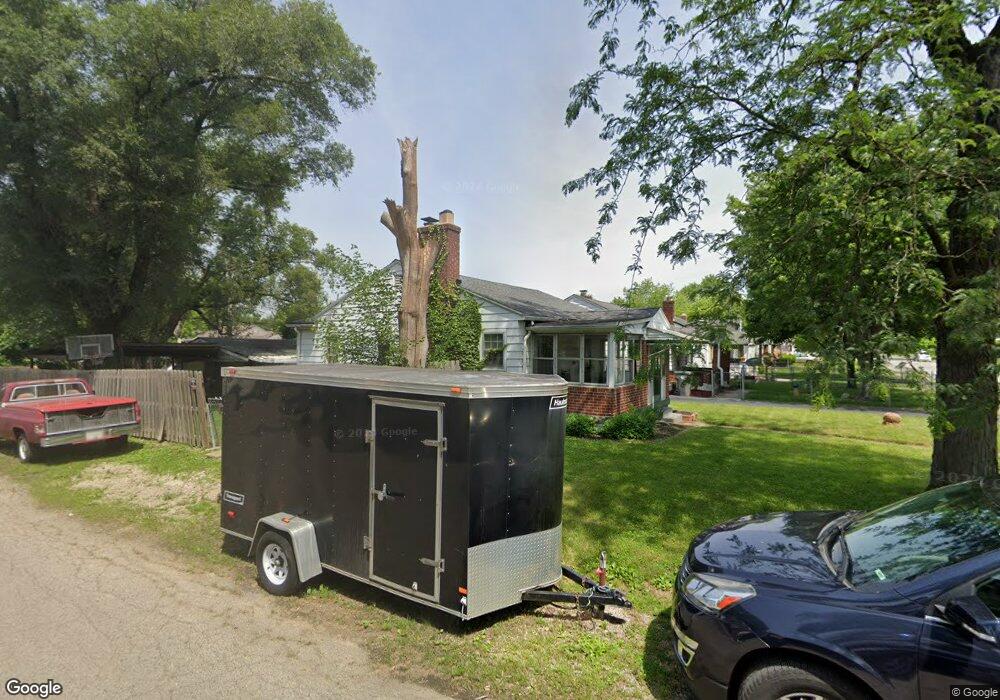
2002 Wallace Ave Indianapolis, IN 46218
Near Eastside NeighborhoodEstimated Value: $116,000 - $164,000
3
Beds
1
Bath
1,756
Sq Ft
$80/Sq Ft
Est. Value
About This Home
This home is located at 2002 Wallace Ave, Indianapolis, IN 46218 and is currently estimated at $140,317, approximately $79 per square foot. 2002 Wallace Ave is a home located in Marion County with nearby schools including Thomas D. Gregg School No. 15, Washington Irving School 14, and Anna Brochhausen School 88.
Ownership History
Date
Name
Owned For
Owner Type
Purchase Details
Closed on
Mar 15, 2022
Sold by
Motorboat Llc
Bought by
Rhino Llc-S Series 2002 Wallace
Current Estimated Value
Purchase Details
Closed on
Feb 10, 2022
Sold by
Motorboat Llc
Bought by
Rhino Llc-S Series 2002 Wallace
Purchase Details
Closed on
Apr 15, 2011
Sold by
Burn The Ships Llc
Bought by
Motorboat Llc
Purchase Details
Closed on
Sep 30, 2010
Sold by
Dakri Awoli F
Bought by
Burn The Ships Llc
Purchase Details
Closed on
Jul 25, 2006
Sold by
Citimortgage Inc
Bought by
Citifinacial Mortgage Co
Home Financials for this Owner
Home Financials are based on the most recent Mortgage that was taken out on this home.
Original Mortgage
$48,600
Interest Rate
5%
Mortgage Type
Commercial
Purchase Details
Closed on
May 9, 2006
Sold by
Feanzi David L and Feanzi Sandra S
Bought by
Citifinancial Mortgage Co Inc
Create a Home Valuation Report for This Property
The Home Valuation Report is an in-depth analysis detailing your home's value as well as a comparison with similar homes in the area
Home Values in the Area
Average Home Value in this Area
Purchase History
| Date | Buyer | Sale Price | Title Company |
|---|---|---|---|
| Rhino Llc-S Series 2002 Wallace | -- | None Listed On Document | |
| Rhino Llc-S Series 2002 Wallace | -- | None Listed On Document | |
| Motorboat Llc | -- | None Available | |
| Burn The Ships Llc | -- | None Available | |
| Citifinacial Mortgage Co | -- | None Available | |
| Citifinancial Mortgage Co Inc | $29,900 | None Available |
Source: Public Records
Mortgage History
| Date | Status | Borrower | Loan Amount |
|---|---|---|---|
| Previous Owner | Citifinacial Mortgage Co | $48,600 |
Source: Public Records
Tax History
| Year | Tax Paid | Tax Assessment Tax Assessment Total Assessment is a certain percentage of the fair market value that is determined by local assessors to be the total taxable value of land and additions on the property. | Land | Improvement |
|---|---|---|---|---|
| 2025 | $1,139 | $53,600 | $10,300 | $43,300 |
| 2024 | $1,179 | $48,000 | $10,300 | $37,700 |
| 2023 | $1,179 | $46,000 | $10,300 | $35,700 |
| 2022 | $1,172 | $46,000 | $10,300 | $35,700 |
| 2021 | $984 | $39,000 | $10,300 | $28,700 |
| 2020 | $816 | $31,700 | $3,600 | $28,100 |
| 2019 | $761 | $28,800 | $3,600 | $25,200 |
| 2018 | $651 | $24,000 | $3,600 | $20,400 |
| 2017 | $544 | $22,000 | $3,600 | $18,400 |
| 2016 | $532 | $22,000 | $3,600 | $18,400 |
| 2014 | $123 | $7,200 | $3,600 | $3,600 |
| 2013 | $11 | $7,200 | $3,600 | $3,600 |
Source: Public Records
Map
Nearby Homes
- 2014 Wallace Ave
- 2047 N Bosart Ave
- 1930 N Bosart Ave
- 4706 E 21st St
- 1907 N Drexel Ave
- 1953 Kildare Ave
- 1905 N Dequincy St
- 2016 Glenridge Dr
- 2029 Kildare Ave
- 1929 N Linwood Ave
- 1925 N Linwood Ave
- 1844 N Riley Ave
- 1731 N Bosart Ave
- 1922 N Bancroft St
- 1946 N Euclid Ave
- 2005 N Bancroft St
- 4301 E 21st St
- 1717 N Euclid Ave
- 1618 N Linwood Ave
- 2033 Forest Manor Ave
- 2006 Wallace Ave
- 2010 Wallace Ave
- 1956 Wallace Ave
- 2010 N Wallace
- 1952 Wallace Ave
- 2001 N Bosart Ave
- 2005 N Bosart Ave
- 2018 Wallace Ave
- 1948 Wallace Ave
- 1961 N Bosart Ave
- 2001 Wallace Ave
- 2013 N Bosart Ave
- 2005 Wallace Ave
- 2009 Wallace Ave
- 1953 Wallace Ave
- 1951 N Bosart Ave
- 2022 Wallace Ave
- 2031 N Bosart Ave
- 2013 Wallace Ave
- 1949 Wallace Ave
Your Personal Tour Guide
Ask me questions while you tour the home.