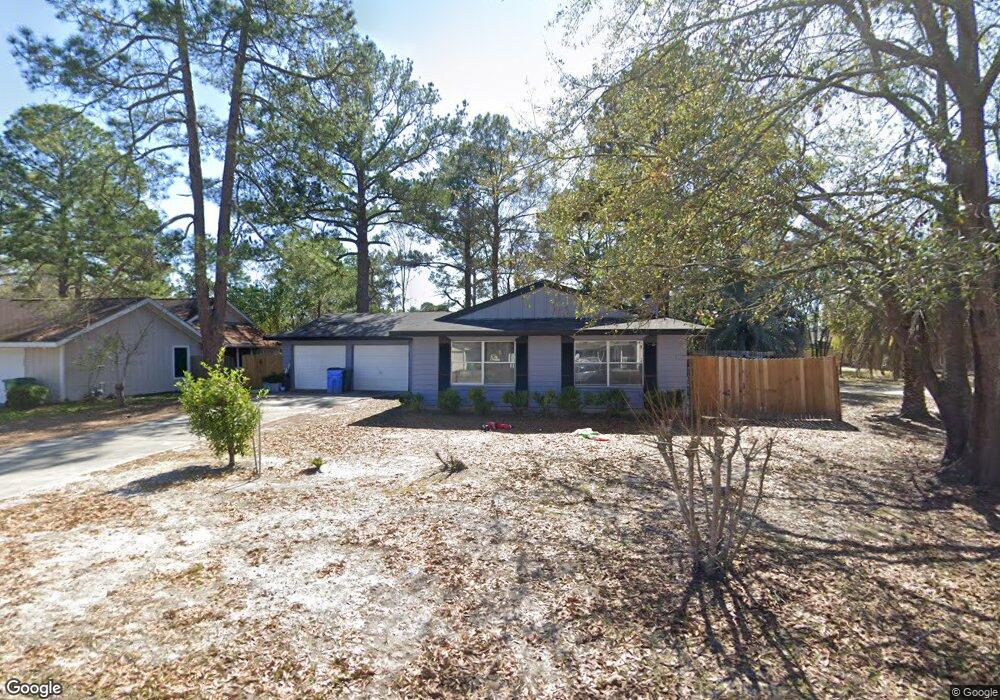
2003 Bradley Ave Valdosta, GA 31602
Estimated Value: $167,000 - $299,000
--
Bed
2
Baths
1,276
Sq Ft
$178/Sq Ft
Est. Value
About This Home
This home is located at 2003 Bradley Ave, Valdosta, GA 31602 and is currently estimated at $227,360, approximately $178 per square foot. 2003 Bradley Ave is a home located in Lowndes County with nearby schools including W.G. Nunn Elementary School, Newbern Middle School, and Valdosta High School.
Ownership History
Date
Name
Owned For
Owner Type
Purchase Details
Closed on
Oct 16, 2023
Sold by
Grofex Real Estate Investment Llc
Bought by
Roan Lorenzo
Current Estimated Value
Purchase Details
Closed on
Apr 6, 2021
Sold by
Marshall Johnnie B
Bought by
Grofex Real Estate Investment Llc
Purchase Details
Closed on
Sep 28, 1998
Bought by
Marshall Johnnie B
Purchase Details
Closed on
Jul 31, 1997
Bought by
King Staley B
Purchase Details
Closed on
Sep 16, 1991
Bought by
Alexander Damon K Etal
Purchase Details
Closed on
Aug 18, 1986
Bought by
Gaskins Charles Robert
Purchase Details
Closed on
Oct 22, 1982
Bought by
Byford John F Jr Etal
Purchase Details
Closed on
May 8, 1979
Bought by
Fennell Roy S Iii Etal
Purchase Details
Closed on
Aug 19, 1977
Bought by
Bacon Richard S Etal
Purchase Details
Closed on
May 3, 1977
Bought by
Phillips Robert
Create a Home Valuation Report for This Property
The Home Valuation Report is an in-depth analysis detailing your home's value as well as a comparison with similar homes in the area
Home Values in the Area
Average Home Value in this Area
Purchase History
| Date | Buyer | Sale Price | Title Company |
|---|---|---|---|
| Roan Lorenzo | $235,000 | -- | |
| Grofex Real Estate Investment Llc | $46,600 | -- | |
| Marshall Johnnie B | $68,500 | -- | |
| King Staley B | $52,000 | -- | |
| Alexander Damon K Etal | $57,500 | -- | |
| Gaskins Charles Robert | $54,500 | -- | |
| Byford John F Jr Etal | $15,300 | -- | |
| Fennell Roy S Iii Etal | $6,500 | -- | |
| Bacon Richard S Etal | $42,700 | -- | |
| Phillips Robert | $7,000 | -- |
Source: Public Records
Tax History Compared to Growth
Tax History
| Year | Tax Paid | Tax Assessment Tax Assessment Total Assessment is a certain percentage of the fair market value that is determined by local assessors to be the total taxable value of land and additions on the property. | Land | Improvement |
|---|---|---|---|---|
| 2024 | $976 | $34,948 | $4,800 | $30,148 |
| 2023 | $976 | $34,948 | $4,800 | $30,148 |
| 2022 | $630 | $26,352 | $4,800 | $21,552 |
| 2021 | $708 | $26,352 | $4,800 | $21,552 |
| 2020 | $723 | $26,352 | $4,800 | $21,552 |
| 2019 | $722 | $26,352 | $4,800 | $21,552 |
| 2018 | $564 | $21,676 | $4,800 | $16,876 |
| 2017 | $568 | $21,676 | $4,800 | $16,876 |
| 2016 | $567 | $21,676 | $4,800 | $16,876 |
| 2015 | -- | $21,676 | $4,800 | $16,876 |
| 2014 | $657 | $36,262 | $12,000 | $24,262 |
Source: Public Records
Map
Nearby Homes
- 7.63 AC Tyndall Dr
- 2019 Fallingleaf Ln
- 11 Crestwood Cir
- 3122 Tyndall Dr
- 2835 Kirkwood Cir
- 3200 Tyndall Dr Unit A/B
- 3202 Tyndall Dr Unit A/B
- TBD Jaycee Shack Rd
- 3016 Ginny Dr
- 1703 Largo Cir
- 2821 Clayton Dr
- 4305 Brandonshire Ln
- 1647 Fresno St
- 4004 Tack Trail
- 1 Pomona Cir
- 4064 Chadwyck Dr
- 2517 Deborah Dr
- 4085 Chadwyck Dr
- 4203 Wilshire Dr
- 309 Tomlinson Dr
- 3005 Tyndall Dr
- 3003 Tyndall Dr
- 2002 Fallingleaf Ln
- 2004 Fallingleaf Ln
- 2007 Bradley Ave
- 2002 Bradley Ave
- 2000 Fallingleaf Ln
- 2004 Bradley Ave
- 2006 Fallingleaf Ln
- 0 Tyndall Dr Unit 62683
- 0 Tyndall Dr Unit 7468626
- 0 Tyndall Dr
- 2000 Bradley Ave
- 2006 Bradley Ave
- 2009 Bradley Ave
- 2008 Fallingleaf Ln
- 2008 Bradley Ave
- 0 Fallingleaf Ln
- 3004 Tyndall Dr
- 3002 Tyndall Dr