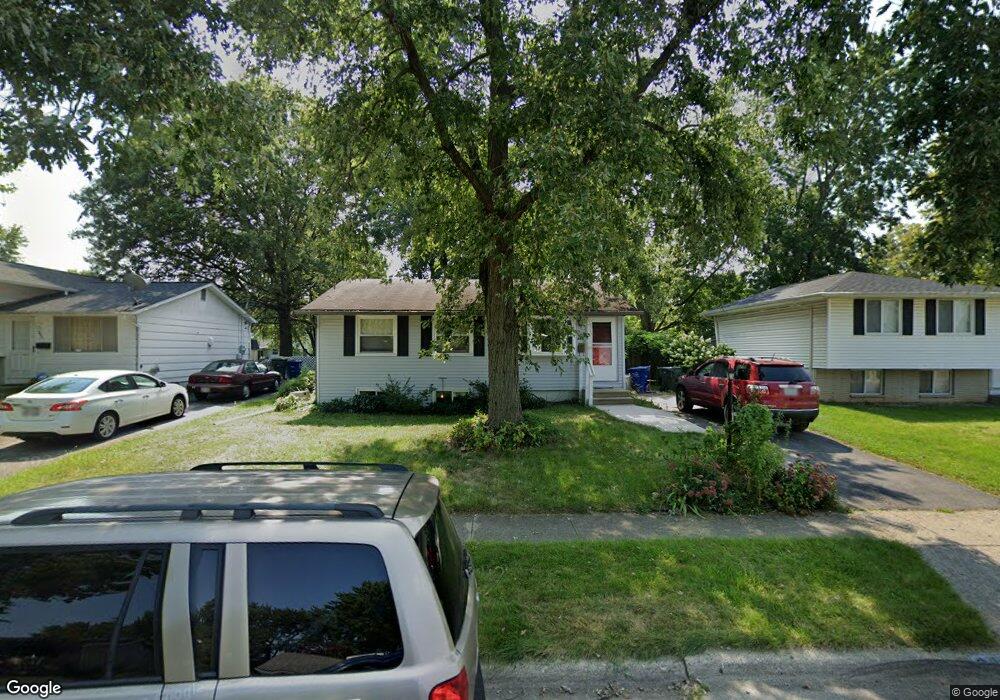
2003 Brookfield Rd Columbus, OH 43229
Forest Park East NeighborhoodEstimated Value: $197,872 - $258,000
3
Beds
1
Bath
896
Sq Ft
$251/Sq Ft
Est. Value
About This Home
This home is located at 2003 Brookfield Rd, Columbus, OH 43229 and is currently estimated at $224,718, approximately $250 per square foot. 2003 Brookfield Rd is a home located in Franklin County with nearby schools including Forest Park Elementary School, Woodward Park Middle School, and Northland High School.
Ownership History
Date
Name
Owned For
Owner Type
Purchase Details
Closed on
Jul 21, 2000
Sold by
Molli Brett J and Molli Kristi L
Bought by
Deerhake Steve B and Beaverson Sheri L
Current Estimated Value
Home Financials for this Owner
Home Financials are based on the most recent Mortgage that was taken out on this home.
Original Mortgage
$88,753
Outstanding Balance
$30,036
Interest Rate
8.27%
Mortgage Type
FHA
Estimated Equity
$194,682
Purchase Details
Closed on
Oct 27, 1994
Sold by
Tittle Gary C
Bought by
Brett J Molli
Home Financials for this Owner
Home Financials are based on the most recent Mortgage that was taken out on this home.
Original Mortgage
$66,500
Interest Rate
8.68%
Mortgage Type
New Conventional
Purchase Details
Closed on
Mar 16, 1990
Purchase Details
Closed on
Aug 28, 1989
Create a Home Valuation Report for This Property
The Home Valuation Report is an in-depth analysis detailing your home's value as well as a comparison with similar homes in the area
Home Values in the Area
Average Home Value in this Area
Purchase History
| Date | Buyer | Sale Price | Title Company |
|---|---|---|---|
| Deerhake Steve B | $88,800 | -- | |
| Brett J Molli | $70,100 | -- | |
| -- | $61,000 | -- | |
| -- | $50,200 | -- |
Source: Public Records
Mortgage History
| Date | Status | Borrower | Loan Amount |
|---|---|---|---|
| Open | Deerhake Steve B | $88,753 | |
| Closed | Brett J Molli | $66,500 |
Source: Public Records
Tax History
| Year | Tax Paid | Tax Assessment Tax Assessment Total Assessment is a certain percentage of the fair market value that is determined by local assessors to be the total taxable value of land and additions on the property. | Land | Improvement |
|---|---|---|---|---|
| 2025 | $2,301 | $51,280 | $16,630 | $34,650 |
| 2024 | $2,301 | $51,280 | $16,630 | $34,650 |
| 2023 | $2,272 | $51,275 | $16,625 | $34,650 |
| 2022 | $1,921 | $37,040 | $10,610 | $26,430 |
| 2021 | $1,925 | $37,040 | $10,610 | $26,430 |
| 2020 | $1,927 | $37,040 | $10,610 | $26,430 |
| 2019 | $1,699 | $28,000 | $7,840 | $20,160 |
| 2018 | $1,479 | $28,000 | $7,840 | $20,160 |
| 2017 | $1,545 | $28,000 | $7,840 | $20,160 |
| 2016 | $1,392 | $21,010 | $7,390 | $13,620 |
| 2015 | $1,263 | $21,010 | $7,390 | $13,620 |
| 2014 | $1,267 | $21,010 | $7,390 | $13,620 |
| 2013 | $769 | $25,865 | $7,770 | $18,095 |
Source: Public Records
Map
Nearby Homes
- 5726 Beechcroft Rd Unit J
- 5732 Beechcroft Rd Unit B
- 5458 Sumac Loop S
- 5485 Tamarack Blvd
- 5491 Parkshire Dr Unit 5491
- 5486 Pine Bluff Rd
- 5556 Parkshire Dr Unit 5556
- 1687 Brookfield Square S
- 2294 Teakwood Dr
- 5885 Beechcroft Rd Unit 306
- 5885 Beechcroft Rd Unit 313
- 1638 Arrowood Loop N
- 2251 Tuliptree Ave
- 2259 Tuliptree Ave
- 1452 Ironwood Dr
- 2236 Strimple Ave
- 2470 Carolina Ave Unit 66
- 6035 Karl Rd
- 1469 Sandalwood Place
- 6048 Pinemoor St
- 1995 Brookfield Rd
- 2011 Brookfield Rd
- 2017 Brookfield Rd
- 2004 Sumac Dr
- 1994 Sumac Dr
- 5568 Durrell Rd
- 5574 Durrell Rd
- 2012 Sumac Dr
- 1988 Sumac Dr
- 2023 Brookfield Rd
- 2004 Brookfield Rd
- 1996 Brookfield Rd
- 2012 Brookfield Rd
- 2020 Sumac Dr
- 1988 Brookfield Rd
- 2018 Brookfield Rd
- 1978 Sumac Dr
- 2031 Brookfield Rd
- 1982 Brookfield Rd
- 2028 Sumac Dr
Your Personal Tour Guide
Ask me questions while you tour the home.