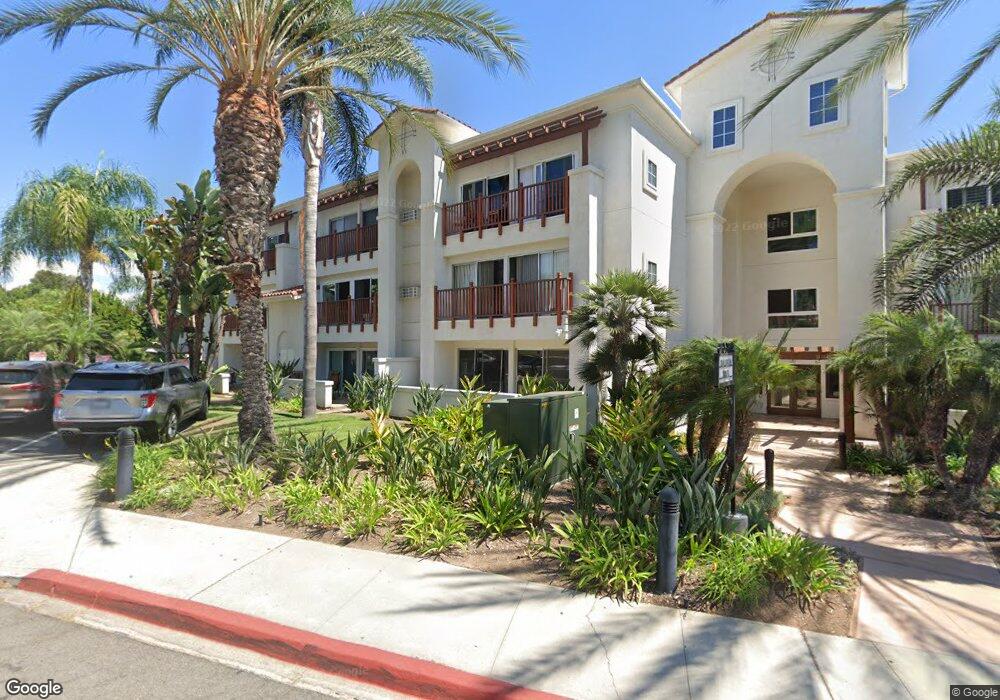
2003 Costa Del Mar Rd Unit 687 Carlsbad, CA 92009
La Costa NeighborhoodEstimated Value: $652,921 - $803,000
1
Bed
2
Baths
800
Sq Ft
$920/Sq Ft
Est. Value
About This Home
This home is located at 2003 Costa Del Mar Rd Unit 687, Carlsbad, CA 92009 and is currently estimated at $735,730, approximately $919 per square foot. 2003 Costa Del Mar Rd Unit 687 is a home located in San Diego County with nearby schools including Poinsettia Elementary School, Aviara Oaks Middle, and Sage Creek High.
Ownership History
Date
Name
Owned For
Owner Type
Purchase Details
Closed on
Mar 23, 2016
Sold by
Batista Michael
Bought by
The Batista Trust
Current Estimated Value
Purchase Details
Closed on
Apr 15, 2013
Sold by
Horwin La Costa Llc
Bought by
Batista Michael
Home Financials for this Owner
Home Financials are based on the most recent Mortgage that was taken out on this home.
Original Mortgage
$206,250
Outstanding Balance
$145,848
Interest Rate
3.51%
Mortgage Type
New Conventional
Estimated Equity
$589,882
Purchase Details
Closed on
Sep 2, 2009
Sold by
Horwin Leonora
Bought by
Horwin La Costa Llc
Purchase Details
Closed on
Dec 23, 2008
Sold by
Horwin Leonora
Bought by
Horwin Leonora
Purchase Details
Closed on
Apr 26, 2002
Sold by
Horwin Leonard
Bought by
Horwin Leonard
Purchase Details
Closed on
Dec 22, 1989
Create a Home Valuation Report for This Property
The Home Valuation Report is an in-depth analysis detailing your home's value as well as a comparison with similar homes in the area
Home Values in the Area
Average Home Value in this Area
Purchase History
| Date | Buyer | Sale Price | Title Company |
|---|---|---|---|
| The Batista Trust | -- | None Available | |
| Batista Michael | $275,000 | Ticor Title Company Of Ca | |
| Horwin La Costa Llc | -- | None Available | |
| Horwin Leonora | -- | None Available | |
| Horwin Leonard | -- | -- | |
| -- | $145,000 | -- |
Source: Public Records
Mortgage History
| Date | Status | Borrower | Loan Amount |
|---|---|---|---|
| Open | Batista Michael | $206,250 |
Source: Public Records
Tax History Compared to Growth
Tax History
| Year | Tax Paid | Tax Assessment Tax Assessment Total Assessment is a certain percentage of the fair market value that is determined by local assessors to be the total taxable value of land and additions on the property. | Land | Improvement |
|---|---|---|---|---|
| 2025 | $4,079 | $338,630 | $193,511 | $145,119 |
| 2024 | $4,079 | $331,991 | $189,717 | $142,274 |
| 2023 | $4,000 | $325,483 | $185,998 | $139,485 |
| 2022 | $3,904 | $319,101 | $182,351 | $136,750 |
| 2021 | $3,840 | $312,845 | $178,776 | $134,069 |
| 2020 | $3,783 | $309,638 | $176,943 | $132,695 |
| 2019 | $3,721 | $303,568 | $173,474 | $130,094 |
| 2018 | $3,578 | $297,617 | $170,073 | $127,544 |
| 2017 | $3,525 | $291,783 | $166,739 | $125,044 |
| 2016 | $3,396 | $286,063 | $163,470 | $122,593 |
| 2015 | $3,353 | $281,767 | $161,015 | $120,752 |
| 2014 | $3,274 | $276,248 | $157,861 | $118,387 |
Source: Public Records
Map
Nearby Homes
- 2003 Costa Del Mar Rd Unit 661
- 2005 Costa Del Mar Rd Unit 636
- 7323 Estrella de Mar Rd Unit 36
- 7323 Estrella de Mar Rd Unit 47
- 7310 Estrella de Mar Rd Unit 6
- 25 El Camino Real
- 7234 Estrella de Mar Rd
- 2348 La Costa Ave Unit 202
- 2433 La Costa Ave Unit A
- 7212 Columbine Dr
- 7373 Alicante Rd Unit 12
- 7359 Alicante Rd
- 2002 Ladera Ct
- 7747 Caminito Monarca Unit 100
- 2319 Caringa Way Unit 58
- 2204 Recodo Ct
- 2349 Altisma Way Unit B
- 2507 Navarra Dr Unit 202
- 1650 Bella Laguna Ct
- 2508 Navarra Dr Unit 424
- 2003 Costa Del Mar Rd Unit ID1248678P
- 2003 Costa Del Mar Rd Unit ID1248689P
- 2003 Costa Del Mar Rd Unit ID1248682P
- 2003 Costa Del Mar Rd Unit ID1248665P
- 2003 Costa Del Mar Rd
- 2003 Costa Del Mar Rd Unit 664-666
- 2003 Costa Del Mar Rd Unit 665
- 2003 Costa Del Mar Rd Unit 663
- 2003 Costa Del Mar Rd Unit 695
- 2003 Costa Del Mar Rd Unit 694
- 2003 Costa Del Mar Rd Unit 693
- 2003 Costa Del Mar Rd Unit 692
- 2003 Costa Del Mar Rd Unit 691
- 2003 Costa Del Mar Rd Unit 690
- 2003 Costa Del Mar Rd Unit 689
- 2003 Costa Del Mar Rd Unit 688
- 2003 Costa Del Mar Rd Unit 686
- 2003 Costa Del Mar Rd Unit 685
- 2003 Costa Del Mar Rd Unit 684
- 2003 Costa Del Mar Rd Unit 683