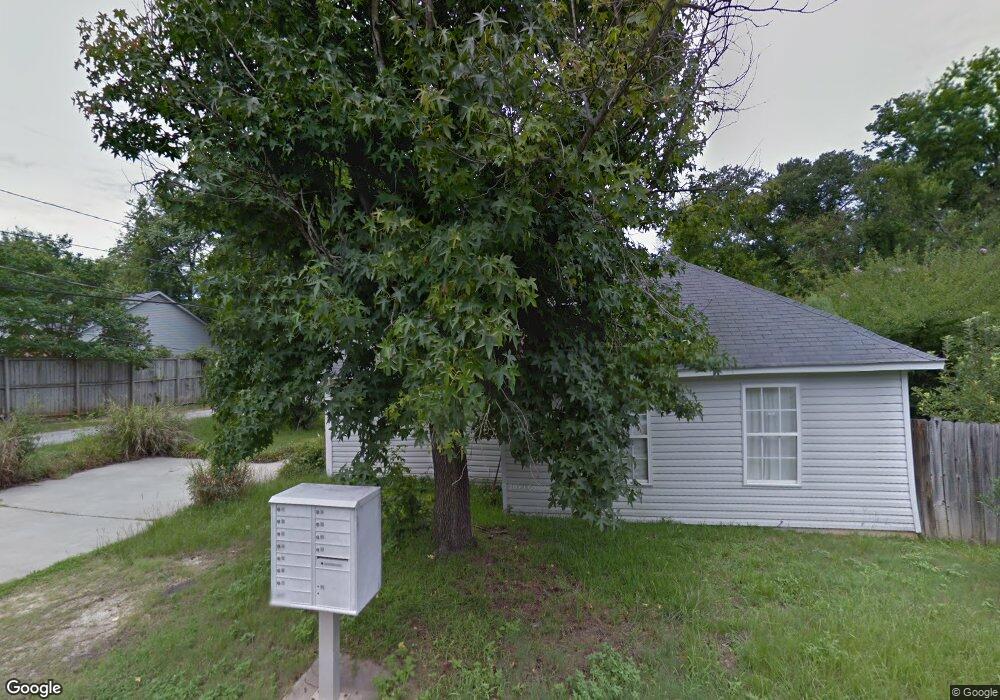
2003 End St Augusta, GA 30909
Forest Hills NeighborhoodEstimated Value: $172,224 - $213,000
3
Beds
2
Baths
1,047
Sq Ft
$184/Sq Ft
Est. Value
About This Home
This home is located at 2003 End St, Augusta, GA 30909 and is currently estimated at $192,306, approximately $183 per square foot. 2003 End St is a home located in Richmond County with nearby schools including Lake Forest Hills Elementary School, Tutt Middle School, and Johnson Magnet.
Ownership History
Date
Name
Owned For
Owner Type
Purchase Details
Closed on
May 10, 2022
Sold by
Rush Enterprises Llc
Bought by
Csra Home Soulutions Llc
Current Estimated Value
Home Financials for this Owner
Home Financials are based on the most recent Mortgage that was taken out on this home.
Original Mortgage
$776,480
Outstanding Balance
$401,360
Interest Rate
4.67%
Mortgage Type
Mortgage Modification
Estimated Equity
-$209,054
Purchase Details
Closed on
Dec 1, 2017
Sold by
Hallford Margaret
Bought by
Rush Enterprises Llc
Home Financials for this Owner
Home Financials are based on the most recent Mortgage that was taken out on this home.
Original Mortgage
$56,000
Interest Rate
3.94%
Mortgage Type
New Conventional
Purchase Details
Closed on
Jul 27, 1998
Sold by
Alexander Homes Inc
Bought by
Hallford Margaret D
Purchase Details
Closed on
Mar 10, 1998
Sold by
T&F Developers Inc
Bought by
Alexander Homes Inc
Purchase Details
Closed on
Aug 25, 1997
Sold by
T&F Developers Inc T & F Developers Inc
Bought by
Alexander Homes Inc
Purchase Details
Closed on
Aug 12, 1997
Sold by
Slaby Richard A Tr
Bought by
T&F Developers Inc
Create a Home Valuation Report for This Property
The Home Valuation Report is an in-depth analysis detailing your home's value as well as a comparison with similar homes in the area
Home Values in the Area
Average Home Value in this Area
Purchase History
| Date | Buyer | Sale Price | Title Company |
|---|---|---|---|
| Csra Home Soulutions Llc | $785,600 | -- | |
| Rush Enterprises Llc | $56,000 | -- | |
| Hallford Margaret D | -- | -- | |
| Alexander Homes Inc | $8,000 | -- | |
| Alexander Homes Inc | -- | -- | |
| T&F Developers Inc | $40,000 | -- |
Source: Public Records
Mortgage History
| Date | Status | Borrower | Loan Amount |
|---|---|---|---|
| Open | Csra Home Soulutions Llc | $776,480 | |
| Previous Owner | Rush Enterprises Llc | $56,000 |
Source: Public Records
Tax History
| Year | Tax Paid | Tax Assessment Tax Assessment Total Assessment is a certain percentage of the fair market value that is determined by local assessors to be the total taxable value of land and additions on the property. | Land | Improvement |
|---|---|---|---|---|
| 2025 | $2,221 | $63,484 | $8,000 | $55,484 |
| 2024 | $2,221 | $47,006 | $8,000 | $39,006 |
| 2023 | $2,314 | $72,935 | $8,023 | $64,912 |
| 2022 | $1,519 | $39,519 | $8,000 | $31,519 |
| 2021 | $1,533 | $36,390 | $8,000 | $28,390 |
| 2020 | $1,400 | $32,980 | $8,000 | $24,980 |
| 2019 | $1,478 | $32,980 | $8,000 | $24,980 |
| 2018 | $1,111 | $32,980 | $8,000 | $24,980 |
| 2017 | $1,305 | $32,980 | $8,000 | $24,980 |
| 2016 | $1,305 | $32,980 | $8,000 | $24,980 |
| 2015 | $1,312 | $32,980 | $8,000 | $24,980 |
| 2014 | $1,314 | $32,980 | $8,000 | $24,980 |
Source: Public Records
Map
Nearby Homes
- 4016 Hidden Haven Ct
- 3134 Switzer Dr
- 700 Bransford Rd
- 1219 Sande Hill Place
- 3071 Walton Way
- 1223 Reid Rd
- 3075 Walton Way
- 3030 Walton Way
- 3011 Fox Spring Rd
- 129 Mayfair Abbey Ln
- 3016 Brems Dr
- 750 Lancaster Rd
- 531 Martin Ln
- 3012 Langford Dr
- 3348 Walton Way
- 565 Martin Ln
- 552 Whitehead Dr
- 601 Wellesley Dr
- 568 Martin Ln
- 704 Summergate Ct
Your Personal Tour Guide
Ask me questions while you tour the home.