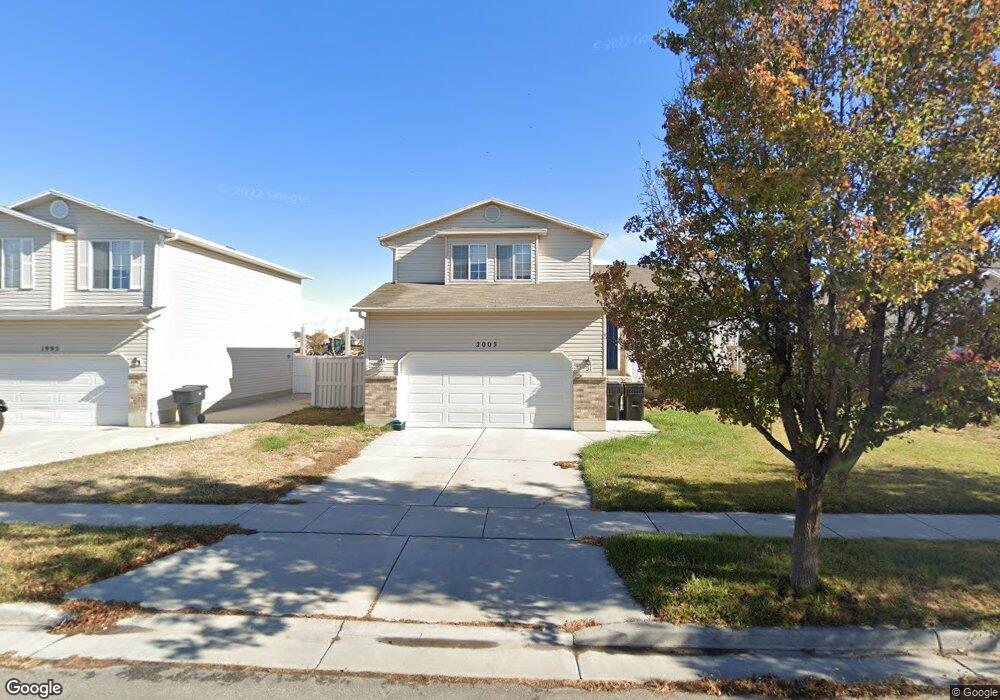
2003 Fremont Crest Ave Syracuse, UT 84075
Estimated Value: $494,000 - $539,000
4
Beds
3
Baths
2,390
Sq Ft
$214/Sq Ft
Est. Value
About This Home
This home is located at 2003 Fremont Crest Ave, Syracuse, UT 84075 and is currently estimated at $510,525, approximately $213 per square foot. 2003 Fremont Crest Ave is a home located in Davis County with nearby schools including Buffalo Point School, Syracuse Junior High School, and Syracuse High School.
Ownership History
Date
Name
Owned For
Owner Type
Purchase Details
Closed on
Mar 13, 2012
Sold by
Chen Shou Ming and Chen Shou Ming
Bought by
Chen Shou Ming and Zhuo Ru
Current Estimated Value
Purchase Details
Closed on
Apr 27, 2009
Sold by
Hebert David M and Hebert Alma M
Bought by
Chen Shou Ming
Home Financials for this Owner
Home Financials are based on the most recent Mortgage that was taken out on this home.
Original Mortgage
$183,150
Outstanding Balance
$116,277
Interest Rate
5.02%
Mortgage Type
FHA
Estimated Equity
$394,248
Purchase Details
Closed on
Oct 8, 2003
Sold by
Woodside Homes Corp
Bought by
Hebert David M and Hebert Alma M
Home Financials for this Owner
Home Financials are based on the most recent Mortgage that was taken out on this home.
Original Mortgage
$149,367
Interest Rate
6.14%
Mortgage Type
VA
Create a Home Valuation Report for This Property
The Home Valuation Report is an in-depth analysis detailing your home's value as well as a comparison with similar homes in the area
Home Values in the Area
Average Home Value in this Area
Purchase History
| Date | Buyer | Sale Price | Title Company |
|---|---|---|---|
| Chen Shou Ming | -- | First American Title | |
| Chen Shou Ming | -- | Equity Title Ins Agency Inc | |
| Hebert David M | -- | Us Title |
Source: Public Records
Mortgage History
| Date | Status | Borrower | Loan Amount |
|---|---|---|---|
| Open | Chen Shou Ming | $183,150 | |
| Previous Owner | Hebert David M | $149,367 |
Source: Public Records
Tax History Compared to Growth
Tax History
| Year | Tax Paid | Tax Assessment Tax Assessment Total Assessment is a certain percentage of the fair market value that is determined by local assessors to be the total taxable value of land and additions on the property. | Land | Improvement |
|---|---|---|---|---|
| 2025 | $2,685 | $259,050 | $98,298 | $160,752 |
| 2024 | $2,707 | $262,899 | $71,243 | $191,656 |
| 2023 | $2,520 | $245,300 | $64,136 | $181,163 |
| 2022 | $2,743 | $484,000 | $98,671 | $385,329 |
| 2021 | $2,383 | $358,000 | $79,619 | $278,381 |
| 2020 | $2,118 | $308,000 | $59,933 | $248,067 |
| 2019 | $2,041 | $293,000 | $65,904 | $227,096 |
| 2018 | $1,888 | $269,000 | $65,546 | $203,454 |
| 2016 | $1,628 | $121,660 | $29,589 | $92,071 |
| 2015 | $1,593 | $113,355 | $29,589 | $83,766 |
| 2014 | $1,519 | $110,197 | $29,589 | $80,608 |
| 2013 | -- | $107,615 | $25,204 | $82,411 |
Source: Public Records
Map
Nearby Homes
- 2679 W Antelope Dr
- 2982 S 3000 W
- 2912 S 3000 W
- 2961 S 2425 W Unit 1123
- 4344 W 1825 S Unit 102
- 4354 W 1825 S Unit 104
- 4348 W 1825 S Unit 103
- 2297 W 2175 S
- 2237 Craig Ln
- 2696 2495 S Unit 207
- 2524 S 3590 W Unit 602
- 2965 S 3000 W
- 2971 S 2425 W Unit 1124
- 2686 S 2440 W Unit 101
- 2635 S 2430 W Unit 114
- 3062 W Solace St
- 2136 W 2200 S
- 2574 S 2430 W Unit 503
- 2104 W 2200 S
- 2455 S Bluff Rd
- 1995 Fremont Crest Ave
- 2013 Fremont Crest Ave
- 1985 Fremont Crest Ave
- 1985 Fremont Crest Ave
- 2023 Fremont Crest Ave
- 2006 Fremont Crest Ave
- 2016 Fremont Crest Ave
- 1996 Fremont Crest Ave
- 2033 Fremont Crest Ave
- 1977 Fremont Crest Ave
- 1996 Fremont Crest Ave
- 2026 Fremont Crest Ave
- 1986 Fremont Crest Ave
- 2036 Fremont Crest Ave
- 2039 Fremont Crest Ave
- 2039 S Fremont
- 2764 W 1975 S
- 2027 Lake Mesa Dr S
- 2037 Lake Mesa Dr S
- 2046 Fremont Crest Ave