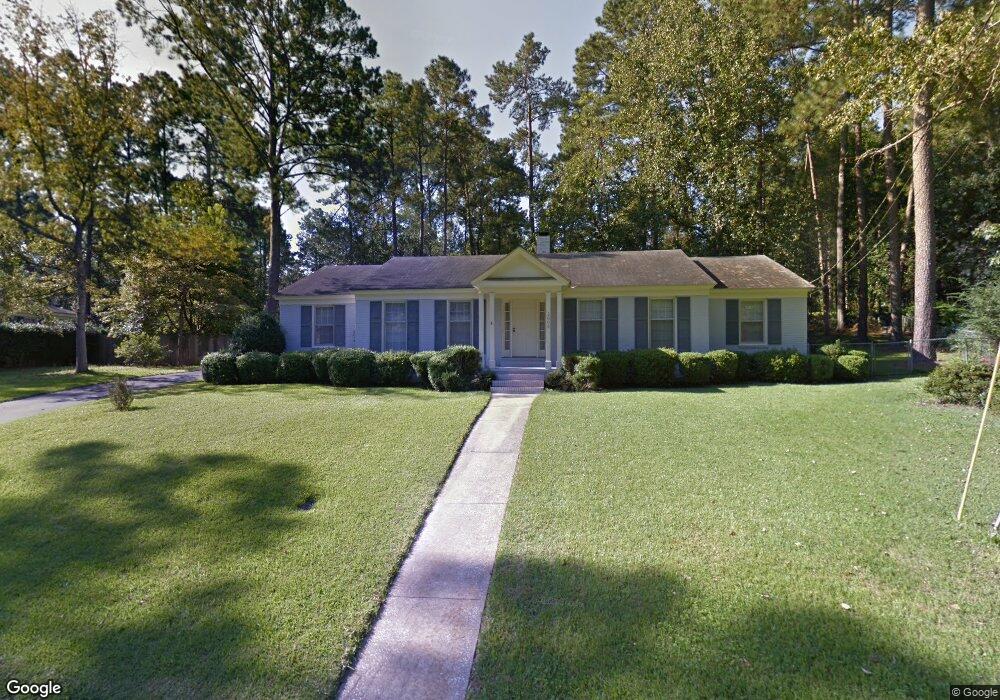
2003 Hammock Dr Valdosta, GA 31602
Estimated Value: $248,999 - $293,000
--
Bed
2
Baths
2,260
Sq Ft
$120/Sq Ft
Est. Value
About This Home
This home is located at 2003 Hammock Dr, Valdosta, GA 31602 and is currently estimated at $271,000, approximately $119 per square foot. 2003 Hammock Dr is a home located in Lowndes County with nearby schools including S.L. Mason Elementary School, Valdosta Middle School, and Valdosta High School.
Ownership History
Date
Name
Owned For
Owner Type
Purchase Details
Closed on
Oct 5, 2015
Sold by
Wiggins Quinnell D Liv
Bought by
Wiggins Richard Lee
Current Estimated Value
Purchase Details
Closed on
Aug 18, 2010
Sold by
Wiggins Quinnell D
Bought by
Quinnell D Wiggins Living Trust
Purchase Details
Closed on
Jun 11, 1990
Bought by
Wiggins Quinnell D
Purchase Details
Closed on
Aug 1, 1989
Bought by
Barker Conoly L
Purchase Details
Closed on
Jul 29, 1988
Bought by
Stewart Roger P
Purchase Details
Closed on
Aug 10, 1983
Bought by
Kane William M and Kane Daryl
Purchase Details
Closed on
Jul 31, 1981
Bought by
Moore Kenneth J Etal
Purchase Details
Closed on
Jun 25, 1980
Bought by
Ruffin Thomas M Etal
Purchase Details
Closed on
Nov 25, 1975
Bought by
Ruffin Thomas M Etal
Purchase Details
Closed on
Jun 13, 1974
Bought by
Danz Raymond A
Purchase Details
Closed on
Apr 24, 1970
Bought by
Dorney Ellsworth E Etal
Create a Home Valuation Report for This Property
The Home Valuation Report is an in-depth analysis detailing your home's value as well as a comparison with similar homes in the area
Home Values in the Area
Average Home Value in this Area
Purchase History
| Date | Buyer | Sale Price | Title Company |
|---|---|---|---|
| Wiggins Richard Lee | -- | -- | |
| Quinnell D Wiggins Living Trust | -- | -- | |
| Wiggins Quinnell D | $115,000 | -- | |
| Barker Conoly L | -- | -- | |
| Stewart Roger P | $9,500 | -- | |
| Kane William M | $79,900 | -- | |
| Moore Kenneth J Etal | -- | -- | |
| Ruffin Thomas M Etal | -- | -- | |
| Ruffin Thomas M Etal | $42,000 | -- | |
| Danz Raymond A | $7,600 | -- | |
| Dorney Ellsworth E Etal | $31,500 | -- |
Source: Public Records
Tax History Compared to Growth
Tax History
| Year | Tax Paid | Tax Assessment Tax Assessment Total Assessment is a certain percentage of the fair market value that is determined by local assessors to be the total taxable value of land and additions on the property. | Land | Improvement |
|---|---|---|---|---|
| 2024 | $2,274 | $91,404 | $18,000 | $73,404 |
| 2023 | $2,274 | $91,404 | $18,000 | $73,404 |
| 2022 | $2,141 | $73,350 | $18,000 | $55,350 |
| 2021 | $1,821 | $62,376 | $18,000 | $44,376 |
| 2020 | $1,860 | $62,376 | $18,000 | $44,376 |
| 2019 | $1,859 | $62,376 | $18,000 | $44,376 |
| 2018 | $1,883 | $62,376 | $18,000 | $44,376 |
| 2017 | $1,896 | $62,376 | $18,000 | $44,376 |
| 2016 | $1,894 | $62,376 | $18,000 | $44,376 |
| 2015 | $1,736 | $62,376 | $18,000 | $44,376 |
| 2014 | $1,762 | $62,376 | $18,000 | $44,376 |
Source: Public Records
Map
Nearby Homes
- 2115 Westfield Dr
- 2201 Riverside Dr
- 2213 Riverside Dr
- 2115 Pinecliff Dr
- 21701 Highpoint Dr
- 5983 Lakeshore Dr
- 2206 Briarcliff Dr
- 2206 Gornto Rd
- 1921 Gornto Rd Unit 19
- 1921 Gornto Rd Unit 5
- 1921 Gornto Rd Unit 6
- 2243 Oakgrove Cir
- 2523 Buena Vista Cir
- 2210 Lakeshore Cir
- 2316 Riverhill Dr
- 2411 Riverside Dr
- 2121 Northwood Cir
- 2092 S Sherwood Dr Unit L100
- 2092 S Sherwood Dr Unit N118
- 2092 S Sherwood Dr Unit E38
- 2001 Hammock Dr
- 2005 Hammock Dr
- 2112 Westfield Dr
- 2110 Westfield Dr
- 2002 Hammock Dr
- 2117 Lakeshore Dr
- 2004 Hammock Dr
- 2000 Hammock Dr
- 2108 Westfield Dr
- 1997 Hammock Dr
- 2007 Hammock Dr
- 2117 Westfield Dr
- 2006 Hammock Dr
- 2116 Lakeshore Dr
- 2119 Lakeshore Dr
- 2113 Westfield Dr
- 1998 Hammock Dr
- 2005 Wood Valley Dr
- 2118 Lakeshore Dr
- 2111 Westfield Dr