
Seller's Agent in 2025
Norma Marini
Keller Williams Coastal Bend -
(361) 225-7900
365 Total Sales
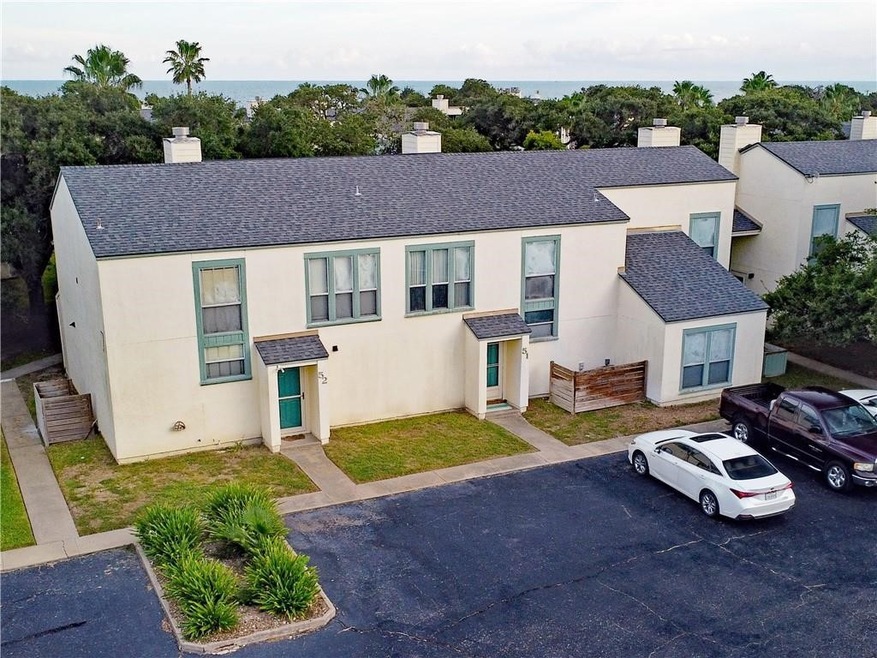
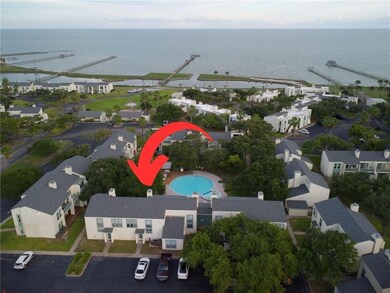
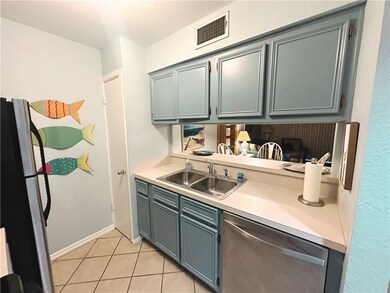
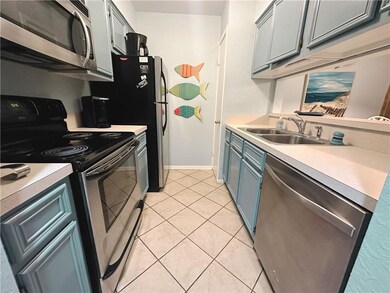
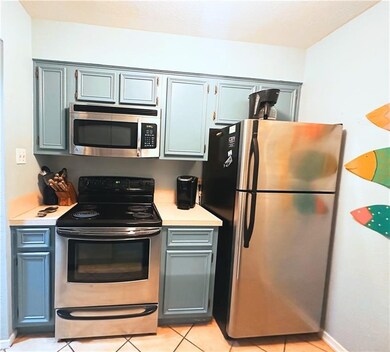
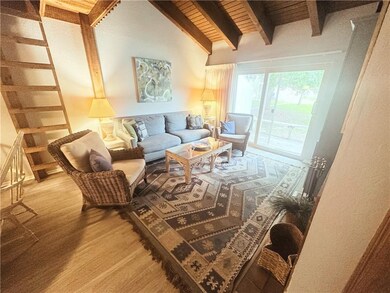
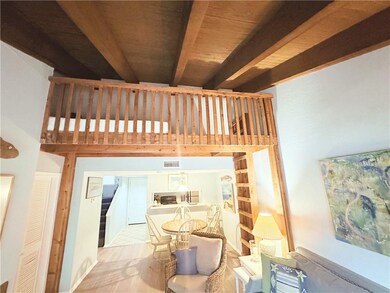
Welcome to Rockport Racquet & Yacht Club Condominiums! Unit 51 Offers 3 Bedrooms, 2 Baths, Bonus Loft and so much more! This unit is not currently in short term rentals but is perfect for your second home or ready to be rented! Enjoy the pool or bring a boat! Ample free parking for Golf Carts. This unit is being offered fully furnished with the exception of a few art pieces.
Last Agent to Sell the Property
Compass RE Texas, LLC. Brokerage Email: info@portaransasrealty.com License #0703253 Listed on: 06/06/2024
Last Buyer's Agent
Non MLS
NONMLS (NonMLS)
Home Type
Est. Annual Taxes
Year Built
Lot Details
HOA Fees
Home Design
Interior Spaces
Kitchen
Flooring
Bedrooms and Bathrooms
Home Security
Pool
Outdoor Features
Schools
Utilities
Listing and Financial Details
Overview
Recreation
Additional Features
| Date | Type | Sale Price | Title Company |
|---|---|---|---|
| Gift Deed | -- | None Available | |
| Warranty Deed | -- | None Available | |
| Vendors Lien | -- | -- |
| Date | Status | Loan Amount | Loan Type |
|---|---|---|---|
| Previous Owner | $280,000 | Commercial |
| Date | Event | Price | Change | Sq Ft Price |
|---|---|---|---|---|
| 07/21/2025 07/21/25 | Price Changed | $189,000 | -40.1% | $203 / Sq Ft |
| 06/11/2025 06/11/25 | Price Changed | $315,395 | +14.7% | $273 / Sq Ft |
| 06/11/2025 06/11/25 | Price Changed | $275,000 | -8.3% | $238 / Sq Ft |
| 06/06/2025 06/06/25 | Price Changed | $299,900 | +39.5% | $260 / Sq Ft |
| 04/26/2025 04/26/25 | Price Changed | $215,000 | -31.7% | $231 / Sq Ft |
| 04/14/2025 04/14/25 | For Sale | $315,000 | +9.8% | $273 / Sq Ft |
| 04/07/2025 04/07/25 | Price Changed | $287,000 | +21.6% | $248 / Sq Ft |
| 04/04/2025 04/04/25 | Price Changed | $236,000 | +0.4% | $254 / Sq Ft |
| 04/03/2025 04/03/25 | For Sale | $235,000 | +2.2% | $253 / Sq Ft |
| 03/15/2025 03/15/25 | For Sale | $230,000 | -34.0% | $248 / Sq Ft |
| 02/26/2025 02/26/25 | For Sale | $348,500 | +3.0% | $302 / Sq Ft |
| 02/05/2025 02/05/25 | For Sale | $338,500 | +14.7% | $293 / Sq Ft |
| 01/08/2025 01/08/25 | Sold | -- | -- | -- |
| 12/10/2024 12/10/24 | Pending | -- | -- | -- |
| 11/25/2024 11/25/24 | Price Changed | $295,000 | -3.3% | $255 / Sq Ft |
| 10/24/2024 10/24/24 | For Sale | $305,000 | +56.4% | $264 / Sq Ft |
| 09/30/2024 09/30/24 | Price Changed | $195,000 | -2.5% | $173 / Sq Ft |
| 09/04/2024 09/04/24 | For Sale | $199,900 | -22.8% | $177 / Sq Ft |
| 04/26/2024 04/26/24 | Sold | -- | -- | -- |
| 02/23/2024 02/23/24 | For Sale | $259,000 | 0.0% | $224 / Sq Ft |
| 01/01/2024 01/01/24 | Pending | -- | -- | -- |
| 12/24/2023 12/24/23 | Off Market | -- | -- | -- |
| 12/12/2023 12/12/23 | Sold | -- | -- | -- |
| 10/02/2023 10/02/23 | Price Changed | $259,000 | -2.3% | $279 / Sq Ft |
| 09/25/2023 09/25/23 | Price Changed | $265,000 | -1.5% | $285 / Sq Ft |
| 09/02/2023 09/02/23 | For Sale | $269,000 | -13.2% | $290 / Sq Ft |
| 08/02/2023 08/02/23 | Sold | -- | -- | -- |
| 07/05/2023 07/05/23 | Pending | -- | -- | -- |
| 06/27/2023 06/27/23 | For Sale | $310,000 | +29.4% | $275 / Sq Ft |
| 05/14/2023 05/14/23 | Off Market | -- | -- | -- |
| 04/28/2023 04/28/23 | Sold | -- | -- | -- |
| 03/05/2023 03/05/23 | Off Market | -- | -- | -- |
| 03/01/2023 03/01/23 | Sold | -- | -- | -- |
| 01/01/2023 01/01/23 | Pending | -- | -- | -- |
| 01/01/2023 01/01/23 | Pending | -- | -- | -- |
| 12/27/2022 12/27/22 | For Sale | $239,500 | -26.3% | $258 / Sq Ft |
| 11/22/2022 11/22/22 | Sold | -- | -- | -- |
| 10/14/2022 10/14/22 | Sold | -- | -- | -- |
| 08/10/2022 08/10/22 | Sold | -- | -- | -- |
| 08/10/2022 08/10/22 | Sold | -- | -- | -- |
| 07/08/2022 07/08/22 | Pending | -- | -- | -- |
| 06/22/2022 06/22/22 | For Sale | $325,000 | +40.1% | $350 / Sq Ft |
| 05/11/2022 05/11/22 | Sold | -- | -- | -- |
| 02/09/2022 02/09/22 | Sold | -- | -- | -- |
| 01/01/2022 01/01/22 | Pending | -- | -- | -- |
| 01/01/2022 01/01/22 | Pending | -- | -- | -- |
| 01/01/2022 01/01/22 | Pending | -- | -- | -- |
| 01/01/2022 01/01/22 | Pending | -- | -- | -- |
| 11/19/2021 11/19/21 | Sold | -- | -- | -- |
| 11/19/2021 11/19/21 | Sold | -- | -- | -- |
| 10/20/2021 10/20/21 | Pending | -- | -- | -- |
| 09/21/2021 09/21/21 | For Sale | $232,000 | -41.9% | $201 / Sq Ft |
| 09/07/2021 09/07/21 | Sold | -- | -- | -- |
| 06/18/2021 06/18/21 | Sold | -- | -- | -- |
| 06/08/2021 06/08/21 | For Sale | $399,000 | +110.0% | $345 / Sq Ft |
| 05/25/2021 05/25/21 | Sold | -- | -- | -- |
| 05/21/2021 05/21/21 | Sold | -- | -- | -- |
| 05/21/2021 05/21/21 | Sold | -- | -- | -- |
| 05/20/2021 05/20/21 | Sold | -- | -- | -- |
| 05/20/2021 05/20/21 | Sold | -- | -- | -- |
| 04/21/2021 04/21/21 | Pending | -- | -- | -- |
| 04/20/2021 04/20/21 | Pending | -- | -- | -- |
| 04/15/2021 04/15/21 | For Sale | $190,000 | -13.6% | $205 / Sq Ft |
| 03/08/2021 03/08/21 | For Sale | $220,000 | +0.5% | $195 / Sq Ft |
| 01/22/2021 01/22/21 | Sold | -- | -- | -- |
| 01/13/2021 01/13/21 | Sold | -- | -- | -- |
| 01/13/2021 01/13/21 | Sold | -- | -- | -- |
| 01/01/2021 01/01/21 | Pending | -- | -- | -- |
| 01/01/2021 01/01/21 | Pending | -- | -- | -- |
| 01/01/2021 01/01/21 | Pending | -- | -- | -- |
| 01/01/2021 01/01/21 | Pending | -- | -- | -- |
| 01/01/2021 01/01/21 | Pending | -- | -- | -- |
| 01/01/2021 01/01/21 | Pending | -- | -- | -- |
| 01/01/2021 01/01/21 | Pending | -- | -- | -- |
| 12/14/2020 12/14/20 | Pending | -- | -- | -- |
| 12/14/2020 12/14/20 | Pending | -- | -- | -- |
| 11/17/2020 11/17/20 | For Sale | $219,000 | +0.2% | $167 / Sq Ft |
| 11/15/2020 11/15/20 | For Sale | $218,500 | -8.6% | $235 / Sq Ft |
| 09/10/2020 09/10/20 | For Sale | $239,000 | 0.0% | $182 / Sq Ft |
| 09/10/2020 09/10/20 | For Sale | $239,000 | +20.1% | $182 / Sq Ft |
| 01/01/2020 01/01/20 | Pending | -- | -- | -- |
| 10/14/2019 10/14/19 | Sold | -- | -- | -- |
| 10/14/2019 10/14/19 | Sold | -- | -- | -- |
| 09/14/2019 09/14/19 | Pending | -- | -- | -- |
| 09/12/2019 09/12/19 | Sold | -- | -- | -- |
| 07/05/2019 07/05/19 | For Sale | $199,000 | +2.1% | $176 / Sq Ft |
| 01/09/2019 01/09/19 | Sold | -- | -- | -- |
| 01/01/2019 01/01/19 | Pending | -- | -- | -- |
| 01/01/2019 01/01/19 | Pending | -- | -- | -- |
| 08/31/2018 08/31/18 | Sold | -- | -- | -- |
| 08/01/2018 08/01/18 | Pending | -- | -- | -- |
| 06/14/2018 06/14/18 | For Sale | $195,000 | -26.4% | $210 / Sq Ft |
| 01/01/2018 01/01/18 | Pending | -- | -- | -- |
| 08/18/2017 08/18/17 | Sold | -- | -- | -- |
| 01/01/2017 01/01/17 | Pending | -- | -- | -- |
| 10/31/2016 10/31/16 | Sold | -- | -- | -- |
| 06/15/2016 06/15/16 | Sold | -- | -- | -- |
| 06/15/2016 06/15/16 | Sold | -- | -- | -- |
| 05/16/2016 05/16/16 | Pending | -- | -- | -- |
| 05/11/2016 05/11/16 | For Sale | $265,000 | +71.1% | $202 / Sq Ft |
| 01/01/2016 01/01/16 | Pending | -- | -- | -- |
| 01/01/2016 01/01/16 | Pending | -- | -- | -- |
| 06/24/2015 06/24/15 | Sold | -- | -- | -- |
| 06/24/2015 06/24/15 | Sold | -- | -- | -- |
| 05/25/2015 05/25/15 | Pending | -- | -- | -- |
| 05/13/2015 05/13/15 | For Sale | $154,900 | -22.0% | $167 / Sq Ft |
| 02/17/2015 02/17/15 | Sold | -- | -- | -- |
| 01/31/2015 01/31/15 | For Sale | $198,500 | +16.8% | $172 / Sq Ft |
| 01/01/2015 01/01/15 | Pending | -- | -- | -- |
| 12/23/2014 12/23/14 | Sold | -- | -- | -- |
| 10/06/2014 10/06/14 | Sold | -- | -- | -- |
| 06/30/2014 06/30/14 | Sold | -- | -- | -- |
| 04/11/2014 04/11/14 | Sold | -- | -- | -- |
| 01/01/2014 01/01/14 | Pending | -- | -- | -- |
| 01/01/2014 01/01/14 | Pending | -- | -- | -- |
| 01/01/2014 01/01/14 | Pending | -- | -- | -- |
| 01/01/2014 01/01/14 | Pending | -- | -- | -- |
| 12/20/2013 12/20/13 | Sold | -- | -- | -- |
| 12/19/2013 12/19/13 | Sold | -- | -- | -- |
| 12/19/2013 12/19/13 | Sold | -- | -- | -- |
| 12/05/2013 12/05/13 | For Sale | $169,900 | +1.4% | $183 / Sq Ft |
| 11/19/2013 11/19/13 | Pending | -- | -- | -- |
| 11/19/2013 11/19/13 | Pending | -- | -- | -- |
| 10/31/2013 10/31/13 | Sold | -- | -- | -- |
| 09/26/2013 09/26/13 | Sold | -- | -- | -- |
| 09/26/2013 09/26/13 | Sold | -- | -- | -- |
| 08/27/2013 08/27/13 | Pending | -- | -- | -- |
| 08/05/2013 08/05/13 | Sold | -- | -- | -- |
| 05/06/2013 05/06/13 | Sold | -- | -- | -- |
| 02/11/2013 02/11/13 | For Sale | $167,500 | -13.7% | $180 / Sq Ft |
| 01/01/2013 01/01/13 | Pending | -- | -- | -- |
| 01/01/2013 01/01/13 | Pending | -- | -- | -- |
| 01/01/2013 01/01/13 | Pending | -- | -- | -- |
| 01/01/2013 01/01/13 | Pending | -- | -- | -- |
| 01/01/2013 01/01/13 | Pending | -- | -- | -- |
| 12/10/2012 12/10/12 | For Sale | $194,000 | +25.2% | $209 / Sq Ft |
| 08/24/2012 08/24/12 | Sold | -- | -- | -- |
| 05/03/2012 05/03/12 | Sold | -- | -- | -- |
| 04/30/2012 04/30/12 | Sold | -- | -- | -- |
| 04/27/2012 04/27/12 | Sold | -- | -- | -- |
| 03/15/2012 03/15/12 | For Sale | $154,900 | 0.0% | $134 / Sq Ft |
| 03/13/2012 03/13/12 | For Sale | $154,900 | +11.4% | $134 / Sq Ft |
| 02/14/2012 02/14/12 | Sold | -- | -- | -- |
| 01/15/2012 01/15/12 | Pending | -- | -- | -- |
| 01/01/2012 01/01/12 | Pending | -- | -- | -- |
| 01/01/2012 01/01/12 | Pending | -- | -- | -- |
| 01/01/2012 01/01/12 | Pending | -- | -- | -- |
| 01/01/2012 01/01/12 | Pending | -- | -- | -- |
| 11/15/2011 11/15/11 | For Sale | $139,000 | -18.2% | $123 / Sq Ft |
| 07/03/2011 07/03/11 | For Sale | $169,900 | -- | $150 / Sq Ft |
| Year | Tax Paid | Tax Assessment Tax Assessment Total Assessment is a certain percentage of the fair market value that is determined by local assessors to be the total taxable value of land and additions on the property. | Land | Improvement |
|---|---|---|---|---|
| 2024 | $148 | $12,480 | $2,760 | $9,720 |
| 2023 | $146 | $12,480 | $2,760 | $9,720 |
| 2022 | $175 | $12,500 | $2,760 | $9,740 |
| 2021 | $183 | $12,510 | $2,760 | $9,750 |
| 2020 | $175 | $11,390 | $1,620 | $9,770 |
| 2019 | $177 | $11,400 | $1,620 | $9,780 |
| 2018 | $177 | $10,930 | $1,620 | $9,310 |
| 2017 | $186 | $11,430 | $1,620 | $9,810 |
| 2014 | -- | $11,460 | $1,620 | $9,840 |
Seller's Agent in 2025
Norma Marini
Keller Williams Coastal Bend -
(361) 225-7900
365 Total Sales
P
Seller's Agent in 2025
Phyllis Kline
Rockport Properties
(361) 557-1235
53 Total Sales
Seller's Agent in 2025
Kelly Blackwell
SPEARS & COMPANY REAL ESTATE
(361) 564-8508
160 Total Sales
Seller's Agent in 2025
Holly Brown
LUCE PROPERTIES
(830) 278-0254
102 Total Sales
R
Seller's Agent in 2025
Reagen Geer
SPEARS & COMPANY REAL ESTATE
(817) 996-2018
83 Total Sales
Seller's Agent in 2025
Tracey Gaines
Coast Properties, LLC
(361) 945-3082
70 Total Sales
Source: South Texas MLS
MLS Number: 442729
APN: R26638