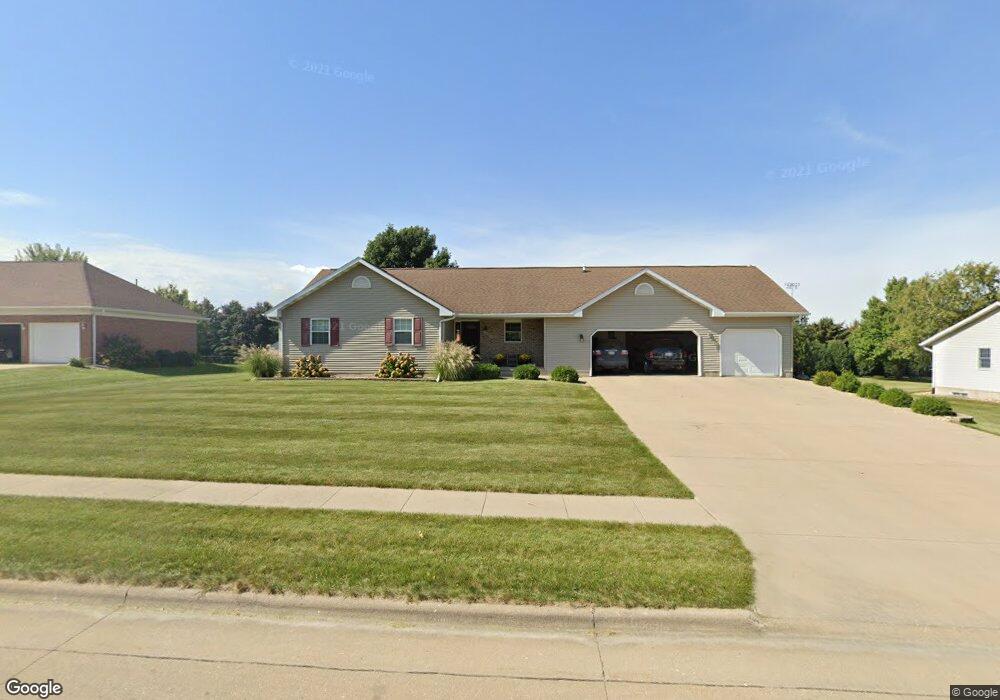
2003 S 1st Ave Vinton, IA 52349
Estimated Value: $348,537 - $397,000
5
Beds
3
Baths
1,955
Sq Ft
$193/Sq Ft
Est. Value
About This Home
This home is located at 2003 S 1st Ave, Vinton, IA 52349 and is currently estimated at $377,384, approximately $193 per square foot. 2003 S 1st Ave is a home located in Benton County with nearby schools including Tilford Elementary School, Shellsburg Elementary School, and Vinton-Shellsburg Middle School.
Ownership History
Date
Name
Owned For
Owner Type
Purchase Details
Closed on
Oct 29, 2010
Sold by
Erickson Bruce A and Erickson Joyce M
Bought by
Erickson Mark A and Erickson Sarah M
Current Estimated Value
Home Financials for this Owner
Home Financials are based on the most recent Mortgage that was taken out on this home.
Original Mortgage
$156,000
Outstanding Balance
$103,048
Interest Rate
4.37%
Mortgage Type
New Conventional
Estimated Equity
$274,336
Create a Home Valuation Report for This Property
The Home Valuation Report is an in-depth analysis detailing your home's value as well as a comparison with similar homes in the area
Home Values in the Area
Average Home Value in this Area
Purchase History
| Date | Buyer | Sale Price | Title Company |
|---|---|---|---|
| Erickson Mark A | $195,000 | -- |
Source: Public Records
Mortgage History
| Date | Status | Borrower | Loan Amount |
|---|---|---|---|
| Open | Erickson Mark A | $156,000 |
Source: Public Records
Tax History Compared to Growth
Tax History
| Year | Tax Paid | Tax Assessment Tax Assessment Total Assessment is a certain percentage of the fair market value that is determined by local assessors to be the total taxable value of land and additions on the property. | Land | Improvement |
|---|---|---|---|---|
| 2025 | $5,600 | $333,600 | $45,400 | $288,200 |
| 2024 | $5,600 | $309,100 | $44,200 | $264,900 |
| 2023 | $5,298 | $309,100 | $44,200 | $264,900 |
| 2022 | $5,438 | $255,100 | $35,400 | $219,700 |
| 2021 | $5,438 | $255,100 | $35,400 | $219,700 |
| 2020 | $4,424 | $238,300 | $28,800 | $209,500 |
| 2019 | $4,452 | $213,200 | $28,800 | $184,400 |
| 2018 | $4,320 | $211,600 | $28,000 | $183,600 |
| 2017 | $4,320 | $211,600 | $28,000 | $183,600 |
| 2016 | $3,974 | $192,900 | $26,200 | $166,700 |
| 2015 | $3,974 | $192,900 | $26,200 | $166,700 |
| 2014 | $3,980 | $192,800 | $0 | $0 |
Source: Public Records
Map
Nearby Homes