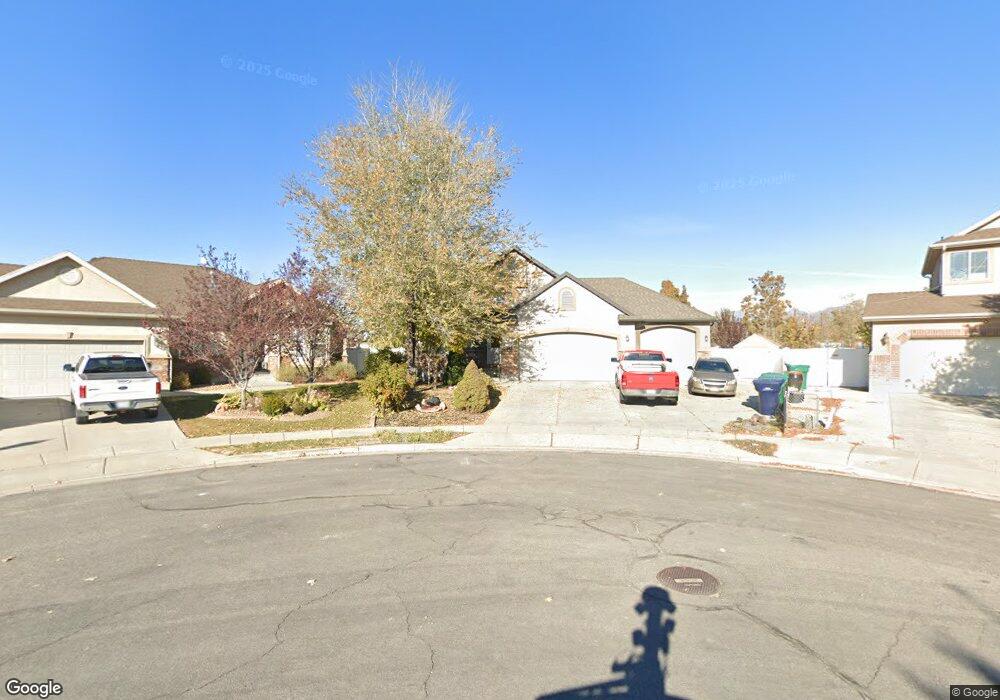
2003 S James Cir Clearfield, UT 84015
Estimated Value: $542,000 - $595,133
--
Bed
3
Baths
1,511
Sq Ft
$378/Sq Ft
Est. Value
About This Home
This home is located at 2003 S James Cir, Clearfield, UT 84015 and is currently estimated at $570,783, approximately $377 per square foot. 2003 S James Cir is a home located in Davis County with nearby schools including South Clearfield Elementary School, North Davis Junior High School, and Clearfield High School.
Ownership History
Date
Name
Owned For
Owner Type
Purchase Details
Closed on
Nov 30, 2020
Sold by
Parker David
Bought by
Pidgeon Robert and Pidgeon Jodie
Current Estimated Value
Home Financials for this Owner
Home Financials are based on the most recent Mortgage that was taken out on this home.
Original Mortgage
$422,211
Outstanding Balance
$375,708
Interest Rate
2.8%
Mortgage Type
FHA
Estimated Equity
$195,075
Purchase Details
Closed on
Jul 31, 2020
Sold by
Sullens Dana
Bought by
Parker David
Purchase Details
Closed on
Oct 22, 2007
Sold by
Burke James
Bought by
Burke James and Sullens Dana
Home Financials for this Owner
Home Financials are based on the most recent Mortgage that was taken out on this home.
Original Mortgage
$292,900
Interest Rate
6.27%
Mortgage Type
Purchase Money Mortgage
Create a Home Valuation Report for This Property
The Home Valuation Report is an in-depth analysis detailing your home's value as well as a comparison with similar homes in the area
Home Values in the Area
Average Home Value in this Area
Purchase History
| Date | Buyer | Sale Price | Title Company |
|---|---|---|---|
| Pidgeon Robert | -- | North Star Title | |
| Parker David | -- | Us Title Company Of U | |
| Burke James | -- | Cottonwood Title Ins Agency | |
| Burke James | -- | Cottonwood Title Ins Agency | |
| Ivory Homes Ltd | -- | Cottonwood Title Ins Agency |
Source: Public Records
Mortgage History
| Date | Status | Borrower | Loan Amount |
|---|---|---|---|
| Open | Pidgeon Robert | $422,211 | |
| Previous Owner | Burke James | $292,900 |
Source: Public Records
Tax History Compared to Growth
Tax History
| Year | Tax Paid | Tax Assessment Tax Assessment Total Assessment is a certain percentage of the fair market value that is determined by local assessors to be the total taxable value of land and additions on the property. | Land | Improvement |
|---|---|---|---|---|
| 2025 | $3,388 | $303,600 | $87,204 | $216,396 |
| 2024 | $3,284 | $296,450 | $83,253 | $213,197 |
| 2023 | $3,018 | $500,000 | $131,614 | $368,386 |
| 2022 | $3,284 | $535,000 | $134,257 | $400,743 |
| 2021 | $3,080 | $417,000 | $86,920 | $330,080 |
| 2020 | $2,685 | $361,000 | $74,756 | $286,244 |
| 2019 | $2,629 | $349,000 | $72,398 | $276,602 |
| 2018 | $2,475 | $320,000 | $64,261 | $255,739 |
| 2016 | $2,305 | $155,815 | $26,230 | $129,585 |
| 2015 | $2,285 | $147,290 | $26,230 | $121,060 |
| 2014 | $2,234 | $145,945 | $26,230 | $119,715 |
| 2013 | -- | $104,013 | $34,749 | $69,264 |
Source: Public Records
Map
Nearby Homes
- 2114 S 825 E
- 1740 N Gregory Dr
- 1992 W Afton Cir
- 1477 N 2375 W
- 1954 Ann St
- 1916 W Gregory Dr
- 1430 N 2100 W
- 1937 W 1620 N
- 2438 W 1400 N
- 1491 N 1875 W
- 1491 N 1875 W Unit 158
- 1487 N 1875 W
- 1487 N 1875 W Unit 159
- 1483 N 1875 W
- 1479 N 1875 W
- 1479 N 1875 W Unit 161
- 1476 N 1875 W Unit 164
- 1596 N Main St Unit 2
- 1463 N 1875 W Unit 165
- 1463 N 1875 W
- 2009 S James Cir
- 2009 S James Cir
- 945 E James Cir
- 2015 S James Cir
- 2015 S James Cir
- 948 E Sam Cir
- 948 E 1950 S
- 937 E James Cir
- 938 E Sam Cir
- 1945 S Sam Cir
- 944 E James Cir
- 2021 S James Cir
- 925 E James Cir
- 928 E Sam Cir
- 928 E Sam Cir
- 928 E 1950 S
- 934 E James Cir
- 2027 S James Cir
- 2027 S James Cir
- 920 E Sam Cir