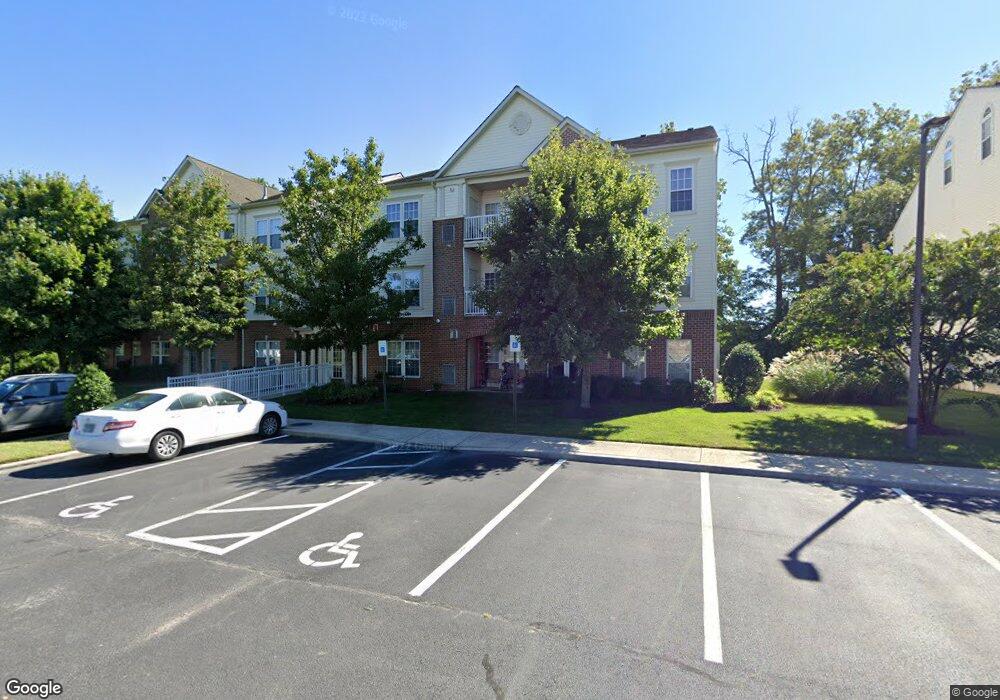
2003 Whispering Ponds Ct Salisbury, MD 21804
North Salisbury NeighborhoodEstimated Value: $186,000 - $202,000
--
Bed
2
Baths
1,422
Sq Ft
$136/Sq Ft
Est. Value
About This Home
This home is located at 2003 Whispering Ponds Ct, Salisbury, MD 21804 and is currently estimated at $193,279, approximately $135 per square foot. 2003 Whispering Ponds Ct is a home located in Wicomico County with nearby schools including Beaver Run Elementary School, East Salisbury Elementary School, and Wicomico Middle School.
Ownership History
Date
Name
Owned For
Owner Type
Purchase Details
Closed on
Oct 4, 2023
Sold by
Disilvestri Joseph and Disilvestri Michelle
Bought by
Vilkas Lauren D
Current Estimated Value
Home Financials for this Owner
Home Financials are based on the most recent Mortgage that was taken out on this home.
Original Mortgage
$6,000
Outstanding Balance
$5,883
Interest Rate
7.18%
Estimated Equity
$187,396
Purchase Details
Closed on
Jun 19, 2018
Sold by
Sherman Judith Anne and Sherman Jefrey Todd
Bought by
Disilvestri Joseph and Disilverstri Michelle
Home Financials for this Owner
Home Financials are based on the most recent Mortgage that was taken out on this home.
Original Mortgage
$85,405
Interest Rate
4.5%
Mortgage Type
New Conventional
Purchase Details
Closed on
Oct 6, 2006
Sold by
Nvr Inc
Bought by
Sherman Jeffery T
Purchase Details
Closed on
Aug 18, 2006
Sold by
Nvr Inc
Bought by
Sherman Jeffery T
Create a Home Valuation Report for This Property
The Home Valuation Report is an in-depth analysis detailing your home's value as well as a comparison with similar homes in the area
Home Values in the Area
Average Home Value in this Area
Purchase History
| Date | Buyer | Sale Price | Title Company |
|---|---|---|---|
| Vilkas Lauren D | $175,000 | Community Title Network | |
| Disilvestri Joseph | $89,900 | None Available | |
| Sherman Jeffery T | $168,165 | -- | |
| Sherman Jeffery T | $168,165 | -- |
Source: Public Records
Mortgage History
| Date | Status | Borrower | Loan Amount |
|---|---|---|---|
| Open | Vilkas Lauren D | $6,000 | |
| Open | Vilkas Lauren D | $169,750 | |
| Previous Owner | Disilvestri Joseph | $85,405 |
Source: Public Records
Tax History Compared to Growth
Tax History
| Year | Tax Paid | Tax Assessment Tax Assessment Total Assessment is a certain percentage of the fair market value that is determined by local assessors to be the total taxable value of land and additions on the property. | Land | Improvement |
|---|---|---|---|---|
| 2025 | $1,063 | $129,833 | $0 | $0 |
| 2024 | $1,063 | $110,900 | $33,200 | $77,700 |
| 2023 | $1,017 | $102,833 | $0 | $0 |
| 2022 | $966 | $94,767 | $0 | $0 |
| 2021 | $886 | $86,700 | $26,000 | $60,700 |
| 2020 | $894 | $86,700 | $26,000 | $60,700 |
| 2019 | $907 | $86,700 | $26,000 | $60,700 |
| 2018 | $1,853 | $88,100 | $26,400 | $61,700 |
| 2017 | $1,790 | $88,100 | $0 | $0 |
| 2016 | -- | $88,100 | $0 | $0 |
| 2015 | $1,997 | $88,100 | $0 | $0 |
| 2014 | $1,997 | $88,100 | $0 | $0 |
Source: Public Records
Map
Nearby Homes
- 2003 Whispering Ponds Ct Unit 1C
- 2005 Whispering Ponds Ct Unit 2A
- 2712 Merritt Mill Rd
- 1801 Woodbrooke Dr
- 316 Autumn Terrace
- 218 Potomac Ave
- 403 Woodcrest Ave
- 200 Benjamin Ave
- 1520 Woodridge Dr
- 31011 Old Ocean City Rd
- 241 Beaglin Park Dr
- 0 Beaglin Park Dr Unit 3 MDWC2013484
- 0 Beaglin Park Dr Unit 2 MDWC2013482
- 0 Beaglin Park Dr Unit MDWC113002
- 6280 Hobbs Rd
- 102 Aydelotte Rd
- 6847 Woodcock Ct
- 117 Justice Ave
- 427 Valleywood Dr
- 503 S Kaywood Dr
- 2003 Whispering Ponds Ct Unit 3A
- 2003 Whispering Ponds Ct Unit 1D
- 2003 Whispering Ponds Ct Unit 2B
- 2003 Whispering Ponds Ct Unit 3D
- 2003 Whispering Ponds Ct Unit 1B
- 2003 Whispering Ponds Ct Unit 2
- 2003 Whispering Ponds Ct
- 2003 Whispering Ponds Ct
- 2003 Whispering Ponds Ct
- 2003 Whispering Ponds Ct
- 2003 Whispering Ponds Ct Unit 2003 1
- 2003 Whispering Ponds Ct Unit 3B
- 2003 Whispering Ponds Ct Unit 20033
- 2003 Whispering Ponds Ct Unit 3C
- 2003 Whispering Ponds Ct Unit 1A
- 2003 Whispering Ponds Ct Unit 1C
- 2003 Whispering Ponds Ct Unit 3D
- 2003 Whispering Ponds Ct Unit 3C
- 2003 Whispering Ponds Ct Unit 3A
- 2003 Whispering Ponds Ct Unit 2D