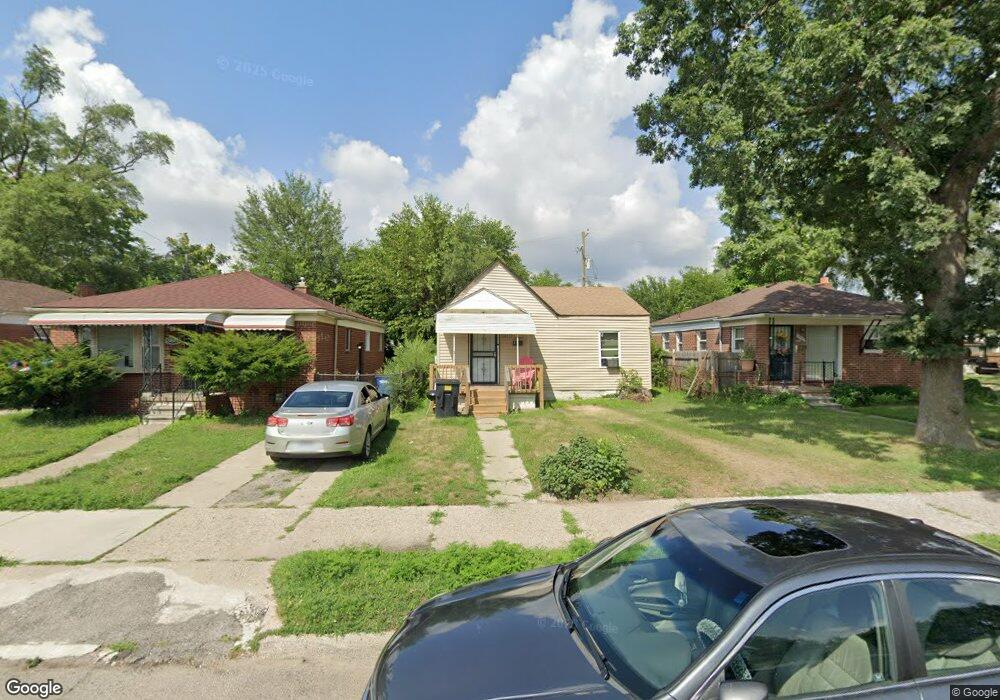
20031 Kentucky St Detroit, MI 48221
Garden Homes NeighborhoodEstimated Value: $69,000 - $111,000
--
Bed
1
Bath
676
Sq Ft
$120/Sq Ft
Est. Value
About This Home
This home is located at 20031 Kentucky St, Detroit, MI 48221 and is currently estimated at $81,251, approximately $120 per square foot. 20031 Kentucky St is a home located in Wayne County with nearby schools including Pasteur Elementary School, Charles L. Spain Elementary-Middle School, and Edward 'Duke' Ellington Conservatory of Music and Art.
Ownership History
Date
Name
Owned For
Owner Type
Purchase Details
Closed on
Feb 13, 2018
Sold by
The Detroit Land Bank Authority
Bought by
Ndewo Llc
Current Estimated Value
Purchase Details
Closed on
Jan 13, 2016
Sold by
Wayne County Treasurer
Bought by
Detroit Land Bank Authority
Purchase Details
Closed on
Dec 15, 2011
Sold by
Yang Hong
Bought by
Detroit Property Management Llc
Purchase Details
Closed on
Feb 15, 2005
Sold by
Abn Amro Mortgage Group Inc
Bought by
Yang Hong
Purchase Details
Closed on
May 5, 2004
Sold by
Zahr Elham
Bought by
Abn Amro Mortgage Group Inc
Purchase Details
Closed on
Sep 15, 2003
Sold by
Makki David S
Bought by
Zahr Elham
Purchase Details
Closed on
Apr 9, 2003
Sold by
Huron Group One Llc
Bought by
Makki David S
Create a Home Valuation Report for This Property
The Home Valuation Report is an in-depth analysis detailing your home's value as well as a comparison with similar homes in the area
Home Values in the Area
Average Home Value in this Area
Purchase History
| Date | Buyer | Sale Price | Title Company |
|---|---|---|---|
| Ndewo Llc | -- | None Available | |
| Detroit Land Bank Authority | -- | None Available | |
| Detroit Property Management Llc | -- | None Available | |
| Yang Hong | $5,000 | Attorneys Title Agency Llc | |
| Abn Amro Mortgage Group Inc | $72,412 | -- | |
| Zahr Elham | $72,000 | -- | |
| Makki David S | $27,000 | William T Sheahan Title Comp | |
| Huron Group One Llc | $7,100 | William T Sheahan Title Comp |
Source: Public Records
Tax History Compared to Growth
Tax History
| Year | Tax Paid | Tax Assessment Tax Assessment Total Assessment is a certain percentage of the fair market value that is determined by local assessors to be the total taxable value of land and additions on the property. | Land | Improvement |
|---|---|---|---|---|
| 2025 | $736 | $22,800 | $0 | $0 |
| 2024 | $736 | $19,200 | $0 | $0 |
| 2023 | $713 | $14,900 | $0 | $0 |
| 2022 | $752 | $9,700 | $0 | $0 |
| 2021 | $735 | $6,460 | $0 | $0 |
| 2020 | $735 | $7,400 | $0 | $0 |
| 2019 | $726 | $5,490 | $0 | $0 |
| 2018 | $240 | $0 | $0 | $0 |
| 2017 | $740 | $0 | $0 | $0 |
| 2016 | $240 | $0 | $0 | $0 |
| 2015 | $740 | $7,400 | $0 | $0 |
| 2013 | $1,044 | $10,439 | $0 | $0 |
| 2010 | -- | $13,843 | $717 | $13,126 |
Source: Public Records
Map
Nearby Homes
- 20043 Wyoming Ave
- 20145 Kentucky St
- 19958 Washburn St
- 19936 Washburn St
- 8817 Pembroke Ave
- 20030 Ohio St
- 8655 Pembroke Ave
- 20134 Griggs St
- 20401 Washburn St
- 20436 Washburn St
- 20451 Kentucky St
- 20145 Northlawn St
- 20484 Wisconsin St
- 19439 Wyoming Ave
- 19442 Ilene St
- 20111 Roselawn St
- 20022 Pinehurst St
- 19434 Ilene St
- 19474 Cherrylawn St
- 20504 Cherrylawn St
- 20025 Kentucky St
- 20039 Kentucky St
- 20015 Kentucky St
- 20049 Kentucky St
- 20009 Kentucky St
- 20030 Wyoming St
- 20038 Wyoming St
- 20018 Wyoming St
- 20046 Wyoming St
- 20030 Kentucky St
- 19999 Kentucky St
- 20038 Kentucky St
- 20020 Kentucky St
- 20054 Wyoming St
- 20012 Wyoming St
- 20054 Kentucky St
- 20000 Kentucky St
- 20103 Kentucky St
- 19989 Kentucky St
- 20039 Indiana St Unit Bldg-Unit