20036 Overland Trail Olympia Fields, IL 60461
Estimated Value: $481,000 - $535,000
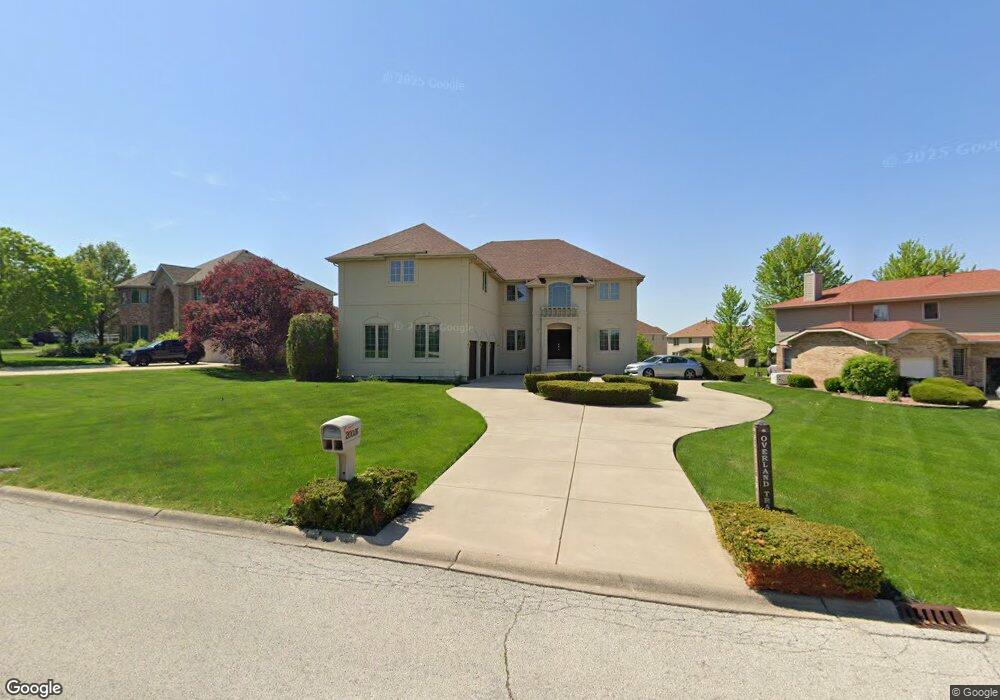
About This Home
This home is located at 20036 Overland Trail, Olympia Fields, IL 60461 and is currently estimated at $509,219, approximately $114 per square foot. 20036 Overland Trail is a home located in Cook County with nearby schools including Illinois School, Arcadia Elementary School, and Indiana Elementary School.
Ownership History
We collect this data history from publicly available records. To have your information removed, we recommend requesting removal directly through your county’s website.
Purchase Details
Home Financials for this Owner
Home Financials are based on the most recent Mortgage that was taken out on this home.Purchase Details
Purchase Details
Home Financials for this Owner
Home Financials are based on the most recent Mortgage that was taken out on this home.Purchase Details
Home Values in the Area
Average Home Value in this Area
Purchase History
We collect this data history from publicly available records. To have your information removed, we recommend requesting removal directly through your county’s website.
| Date | Buyer | Sale Price | Title Company |
|---|---|---|---|
| $312,000 | -- | ||
| $60,000 | -- | ||
| -- | -- | ||
| $59,000 | -- |
Mortgage History
We collect this data history from publicly available records. To have your information removed, we recommend requesting removal directly through your county’s website.
| Date | Status | Borrower | Loan Amount |
|---|---|---|---|
| Open | $303,900 | ||
| Previous Owner | $49,000 |
Tax History
We collect this data history from publicly available records. To have your information removed, we recommend requesting removal directly through your county’s website.
| Year | Tax Paid | Tax Assessment Tax Assessment Total Assessment is a certain percentage of the fair market value that is determined by local assessors to be the total taxable value of land and additions on the property. | Land | Improvement |
|---|---|---|---|---|
| 2025 | $16,834 | $42,000 | $6,182 | $35,818 |
| 2024 | $16,834 | $42,000 | $6,182 | $35,818 |
| 2023 | $16,065 | $42,000 | $6,182 | $35,818 |
| 2022 | $16,065 | $31,709 | $6,869 | $24,840 |
| 2021 | $15,993 | $31,707 | $6,868 | $24,839 |
| 2020 | $14,736 | $31,707 | $6,868 | $24,839 |
| 2019 | $15,544 | $33,092 | $6,181 | $26,911 |
| 2018 | $15,431 | $33,092 | $6,181 | $26,911 |
| 2017 | $14,948 | $33,092 | $6,181 | $26,911 |
| 2016 | $14,163 | $30,701 | $5,494 | $25,207 |
| 2015 | $14,055 | $30,701 | $5,494 | $25,207 |
| 2014 | $13,764 | $30,701 | $5,494 | $25,207 |
| 2013 | $13,434 | $32,731 | $5,494 | $27,237 |
Map
- 3330 Oregon Trail
- 3415 Vollmer Rd Unit 308
- 3439 Vollmer Rd Unit 108
- 3427 Vollmer Rd Unit 309
- 3427 Vollmer Rd Unit 202
- 3451 Ithaca Rd
- 20331 Fairfield Ave
- 20015 Delphi Dr
- 2904 Athena Ct
- 2908 Athena Ct
- 20436 Arcadian Dr
- 20001 Arquilla Cir
- 3118 Polly Ln
- 20535 Marathon Ct
- 20626 Greenwood Dr
- 1429 Woodhollow Dr Unit 2
- 20636 Greenwood Dr
- 1402 Woodhollow Dr Unit 1
- 3231 Chestnut Dr
- 2747 Perry Rd
- 20024 Overland Trail
- 20112 Overland Trail
- 3262 Platt Trail
- 3262 Platt Trail
- 3262 Platt Trail
- 3259 Platt Trail
- 3318 Oregon Trail
- 20012 Overland Trail
- 20115 Overland Trail
- 20021 Overland Trail
- 20118 Overland Trail
- 20121 Overland Trail
- 3251 Platt Trail
- 20009 Overland Trail
- 20124 Overland Trail
- 3336 Oregon Trail
- 20129 Overland Trail
- 20129 Overland Trail
- 3243 Platt Trail
- 3250 Oregon Trail
Ask me questions while you tour the home.